The monthly non-farm payroll or employment report is arguably one of the most influential economic releases in the US. While it may not be the best leading economic indicator, it does move the market.
I have been surprised by the non-farm payroll report in the past and for some reason these surprises have tended to work against my directional and non-directional strategies. As a result, I decided to construct a model to help me forecast the monthly NFP data, which allows me to evaluate the prospective implications for all of my strategies.
Non-Farm Payroll (NFP) Model Forecast - October 2012
The table in Figure 1 below provides the monthly non-farm payroll data for two months: August 2012 and September 2012. The August data was released last month and the non-farm payroll data for September 2012 will be released tomorrow at 8:30 AM EDT.
The model forecasts are in the third data row of the table (in black). The standard error of the model is approximately 121,500. The first and last data rows of the table report the forecast plus one standard error (in red) and the forecast minus one standard error (in green), respectively. If the model errors were normally distributed, roughly 68% of the observations would fall between plus and minus one standard error of the forecast.
The actual non-farm payroll release for August 2012 is in the second data row of the table (in blue). The consensus estimate (reported by Briefing.com) for September 2012 is also in the second data row of the table (in blue). Finally, the last column of the table includes the estimated changes from August 2012 to September 2012.
Model Commentary
The model forecast for September is 62,000, which is up 35,000 from last month's forecast. The Briefing.com consensus estimate for September is 130,000, which is 0.57 standard errors above the model forecast. Based exclusively on the model forecast for September, it would be tempting to bet on a negative NFP surprise tomorrow.
However, the actual NFP data has been coming in consistently above the model forecasts for the last two years. In fact, since November 2010 the average of all monthly model errors (positive and negative) has been + 0.62 standard errors. The probability of a single forecast error exceeding + 0.62 standard errors is only 26.76%. The likelihood of 24 consecutive monthly errors averaging +0.62 standard errors is extremely remote, but that's what happened.
There appears to be something special about this two-year period that is not being captured by the model. Either there is a missing variable that is unique to this period or the actual NFP data may be overstating the true employment environment. In either event, it would be risky to ignore this recent bias.
The actual error last month (August) was +0.57 standard errors, which coincidentally is exactly the same as the deviation of the September Briefing.com consensus versus the model forecast. Including the recent model bias, the Briefing.com consensus of 130,000 jobs appears to be reasonable. Even with the recent model bias, any number above 183,000 (+ 1.0 SE) would be suspect.
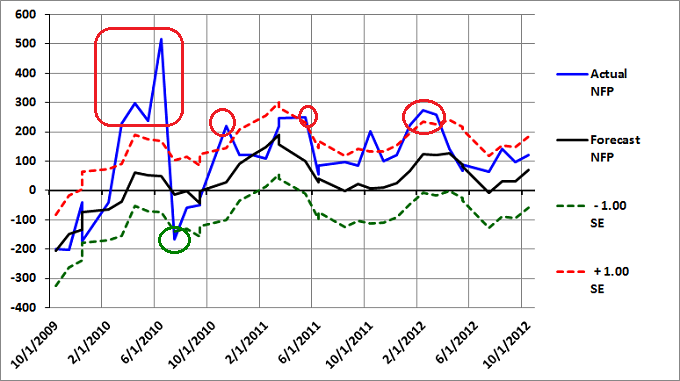
Since the model forecasts have been consistently low for the last two years and the standard error is over 120,000, how can we use the model forecasts? Even with these issues, errors beyond plus or minus one standard error are still significant and typically lead to corrections in the following months. Figure 2 below is a graph of the forecast and actual NFP data for the past three years.
Notice that errors in excess of one standard error (above the red or below the green dashed lines) may persist for several months, but eventually revert to the forecast. One such period was in early 2010, when the actual NFP data were much higher than the forecast, well above the plus 1.0 standard error line. In fact, one month the error reached +3.84 standard errors. The following month, the NFP forecast error dropped to -1.25 standard errors, partially offsetting the overstated NFP reported values for the proceeding four months.
Conclusion
Using basic forecasting tools can help you identify extreme economic data values, which may revert to the forecast over subsequent months. Identifying such periods may help you protect your portfolio from these corrections and help you determine the optimal entry and exit points for your strategies.
Feedback
Your comments, feedback, and questions are always welcome and appreciated. Please use the comment section at the bottom of this page or send me an email.
Do you have any questions about the material? What topics would you like to see in the future?
Referrals
If you found the information on www.TraderEdge.Net helpful, please pass along the link to your friends and colleagues or share the link with your social or professional networks.
The "Share / Save" button below contains links to all major social and professional networks. If you do not see your network listed, use the down-arrow to access the entire list of networking sites.
Thank you for your support.
Brian Johnson
Copyright 2012 - Trading Insights, LLC - All Rights Reserved.


Pingback: Anomalies in Recent Economic Data | Trader Edge