
Last week I introduced a framework for adding to losing positions safely. It is also possible to enhance returns without increasing risk by adding to your winning positions. The approach is called pyramid trading (not to be confused with pyramid schemes, which are obviously illegal). This article uses a simple trade example to demonstrate how to apply pyramid trading to any long-term trend-following strategy. The secret is position-dependent stop levels.
Pyramid Trading
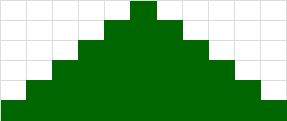
Figure 1: Pyramid Structure
Pyramid trading can be used with long or short positions. However, to keep things simple and as intuitive as possible, I will describe pyramid trading in terms of long positions (purchases). The foundation or base of the pyramid begins with the first purchase of a specified number of shares of stock or futures contracts. Incremental purchases are made when the price rises by a predetermined amount or when a new trading signal is triggered. Each purchase adds a new layer to the pyramid. By construction, the number of shares or contracts traded must decrease with each incremental purchase. Finally, stop levels must be adjusted (increased) after every purchase to ensure risk does not increase as the size of the position grows.
The payoffs from profitable pyramid trades can be huge. However, due to the increase in stop levels, pyramid trading will reduce the number of profitable trades. As a result, pyramid trading should only be used with long-term strategies that are designed to capitalize on long-term trends. These types of strategies provide the optimal environment for capturing prolonged price movements with extremely large positions.
A Specific Trade Example
Gold is one of the most popular trend-following instruments. For example purposes, we will examine a trend-following pyramid trade in gold futures (GC) from January 2009 to February 2013. The top panel in Figure 2 below is a weekly candlestick chart of the continuous gold futures contract. The four vertical lines denote the four pyramid purchases in 2009 and 2010 and the red vertical line marks the trade exit in 2013.
The initial buy and sell signals were generated with a very basic (sample) trend-following strategy. The initial buy signal was generated when the weekly closing price exceeded the highest high of a given number of weeks (jagged green horizontal line). The sell signal was generated when the weekly closing price fell below the lowest low of a specified number of weeks (jagged red horizontal line). The first purchase was made on January 23, 2009 at $930.80 and the entire position was closed on February 15, 2013 at $1614.94 (at which point a new short position would have been established).
The blue line in the bottom panel of Figure 2 below represents the Average True Range (ATR), which is one of the many indicators created by J. Welles Wilder. At the inception of the trade on January 23, 2009, the ATR of the continuous gold futures contract was $68.46, which was a proxy for the average weekly price movement (or volatility) of gold.
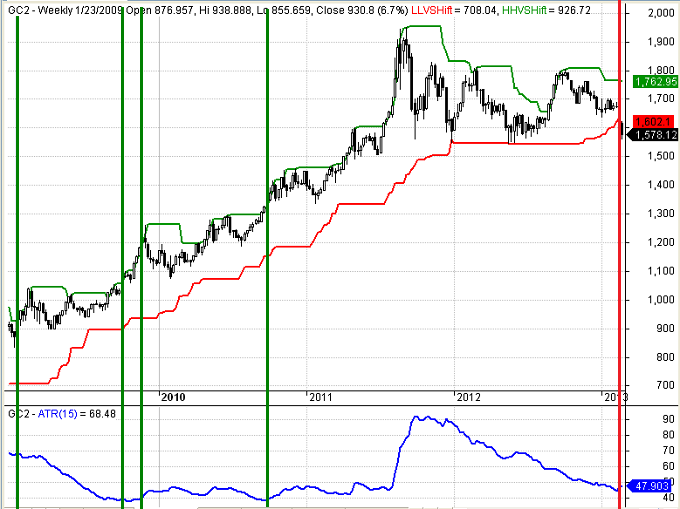
Figure 2: Gold (GC) Pyramid Weekly Candlestick Chart
The Golden Pyramid
The trend-following buy signal was generated on January 23, 2009, which prompted the purchase of four gold futures contracts at $930.80. The initial stop level for the trade was placed two ATRs below the initial purchase price ($930.80 - 2(68.46) = $793.88).
The gold futures contract has a multiplier of 100, which means that every $1 move in the price of gold results in a $100 change in the value of each contract. If the original four contracts were sold at the stop price of $793.88, the maximum loss would have been $54,768 (4 contracts x ($930.80 original price - $793.88 stop level) x 100 multiplier).
I estimated the initial margin required for the initial purchase of four contracts based on the current margin requirement of $8,800 per gold contract (4 contracts x $8,800 per contract = $35,200). See purchase #1 in the Gold Pyramid Trade table (Figure 3) below.
The three incremental purchases were made when the price of gold increased by a total of two ATRs, four ATRs, and six ATRs from the original purchase price. The resulting purchase levels were $1067.72 [$930.80 + 2($68.16)], $1204.64 [$930.80 + 4($68.16)], and $1341.56 [$930.80 + 6($68.16)]. These three incremental purchase levels formed the second, third, and fourth and final level of the pyramid structure. As described above, the number of contracts traded must decrease with each incremental purchase. In this example, three, two, and one contracts were purchased after the original purchase of four contracts.

Figure 3: Gold Pyramid Trade Table
The Key Ingredient: Position-Dependent Stop Levels
The key to pyramid trading is calculating the correct stop level after every incremental purchase. The original purchase price and stop level established a maximum loss amount of $54,768, which we will assume is a reasonable percentage of the trader's total capital (see “Stop Loss Orders are Not Enough.”).
Three additional contracts were purchased on October 6, 2009 at $1067.72. At the time, the cumulative profit on the first four contracts was $54,768 [($1067.72 - $930.80) x 4 x 100]. Use the following formula to calculate the new stop level after each incremental purchase.
New stop level = Current price- [(cumulative profit - desired max loss) / (cumulative contracts x multiplier)]
New stop level after second purchase = $1067.72- [($54,768 - (-$54,768)) / (7 x 100)]
New stop level second purchase = $1067.72 - [($109,536) / (700)] = $1067.72 - $156.48 = $911.24
Notice that we have increased the number of contracts, but the maximum loss remains the same (assuming we were able to liquidate the entire position at the stop price).
After the third purchase, there is enough profit in the position that we could have moved our stop to break-even, which makes it much easier emotionally to trade a trend-following pyramid trading strategy in practice. As a rule of thumb, you could move the stop to break-even when the cushion between the current price and the stop level exceeds the original stop width (in this case two ATRs). In our example, this was possible after the third purchase. Again, we will use the same formula to calculate the stop level after the third purchase, but we will use a break-even loss of zero instead of the original loss of -$54,768.
New stop level = Current price- [(cumulative profit - desired max loss) / (cumulative contracts x multiplier)]
New stop level after third purchase = $1204.64- [($150,612 - (0)) / (9 x 100)]
New stop level second purchase = $1204.64- [($150,612) / (900)] = $1204.64 - $167.35 = $1037.29
Note, the new stop level of $1037.29 is more than two ATRs below the current price of $1204.64 ($1204.64 - 2($68.46) = $1067.72).
The same process is used to calculate the stop level after the fourth and final purchase. The stop levels were never hit. The sell signal occurred on February 15, 2013 and all 10 contracts were sold at a price of $1,614.94. The total gain was $547,220. Without employing the pyramid structure, the total gain on four contracts would have been $273,656. In this example, the pyramid structure doubled the total profit without increasing the amount of capital at risk.
Summary
Using a pyramid trading strategy to add to winning positions can be very profitable. However, pyramid trading should only be used in conjunction with long-term trend following strategies that are designed to capture large, extended price moves. In addition, the number of shares or contracts traded must decrease with each incremental purchase and the stop levels must be increased after every purchase to ensure risk does not increase as the size of the position grows. If you follow these rules with the appropriate strategy, you could enhance your returns without increasing your risk.
Trader Edge Strategy E-Subscription Now Available: 20% ROR
The Trader Edge Asset Allocation Rotational (AAR) Strategy is a conservative, long-only, asset allocation strategy that rotates monthly among five large asset classes. The AAR strategy has generated 20%+ annual returns over the combined back and forward test period (1/1/1990 to 7/29/2013). Please use the above link to learn more about the AAR strategy.
Feedback
Your comments, feedback, and questions are always welcome and appreciated. Please use the comment section at the bottom of this page or send me an email.
Referrals
If you found the information on www.TraderEdge.Net helpful, please pass along the link to your friends and colleagues or share the link with your social or professional networks.
The "Share / Save" button below contains links to all major social and professional networks. If you do not see your network listed, use the down-arrow to access the entire list of networking sites.
Thank you for your support.
Brian Johnson
Copyright 2013 - Trading Insights, LLC - All Rights Reserved.


