I have written a number of recent articles about the troubling state of the equity markets. There have been many causes for concern: technical, fundamental, valuation, divergences, and global risks, among others. All of these are important, but none are more important than earnings and revenue growth, the prerequisites for sustainable bull markets.
It has been a while since I have written about earnings and revenue growth and the recent trends in both are extremely troubling. FactSet is one of the leading providers of data and analytics and is arguably the best source for information and analysis of equity earnings and revenue trends. FactSet publishes a weekly Earnings Insight report, which is the source for all of the charts and data for this article.
FactSet Earnings and Revenue Data
Here are several key S&P 500 observations from the latest FactSet Earnings Insight report dated October 30, 2015:
"The blended earnings decline for Q3 2015 is -2.2%. If this is the final earnings decline for the quarter, it will mark the first time the index has seen two consecutive quarters of year-over-year declines in earnings since Q2 2009 and Q3 2009. It will also mark the largest year-over-year decline in earnings since Q3 2009 (-15.5%)."
"The blended revenue decline for Q3 2015 is -2.9%. If this is the final revenue decline for the quarter, it will mark the first time the index has seen three consecutive quarters of year-over-year revenue declines since Q1 2009 through Q3 2009."
To make matters worse, FactSet reports that analysts are predicting earnings and revenue declines of 2.7% and 2.1% for the S&P 500 in Q4 2015.
Earnings versus Price
The above FactSet data indicates that earnings and revenue are both declining and are expected to continue to do so through year-end. What about equity prices? Unfortunately, equity prices have risen. Take a look at Figure 1 below. The dashed green line represents the price of the S&P 500, which rose steadily from 9/30/15 to 10/30/15 (+8%). Conversely, the solid blue line represents the expected Q4 2015 EPS for the S&P 500, which dropped by roughly 2.5% over the same period. That's right, prices rose 8% while expected earnings declined by 2.5%. Not a good combination.
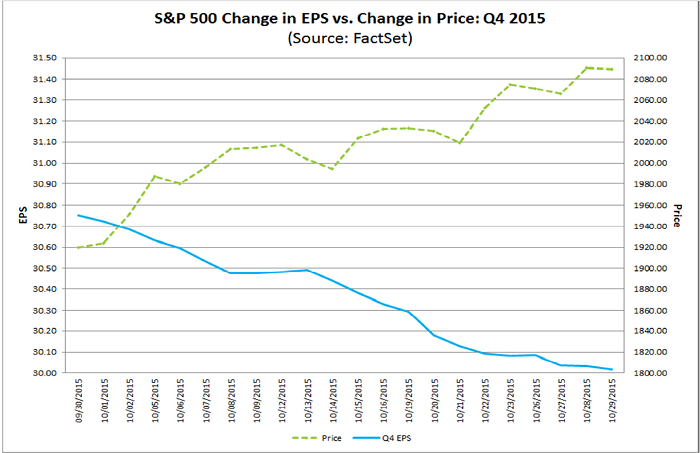
Figure 1: FactSet Change in EPS vs Price Q4 2015
Similarly, the chart in Figure 2 below illustrates the long-term behavior of price and the 12-month forward EPS for the S&P 500. The relationship between price and EPS is very consistent until mid-2013, when the price of the S&P 500 began to grow much faster than the growth rate in EPS. Price increases that are not supported by earnings growth are not sustainable.
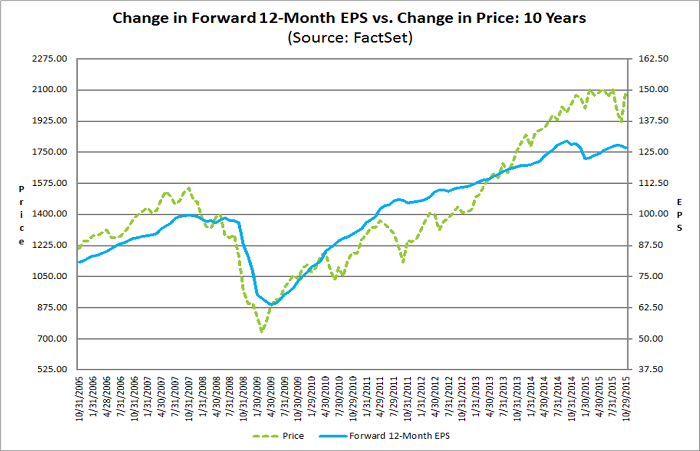
Figure 2: FactSet Change in Forward EPS vs Price
P/E Ratios Increase
When price increases are not supported by earnings growth, price-earnings (P/E) ratios increase. In this environment, investors are willing to pay higher prices for the same dollar of earnings. When P/E ratios are below long-term averages, P/E expansion is benign. However, when P/E ratios are significantly above long-term averages and P/E ratios expand further, that is real cause for concern.
The blue line in Figure 3 below represents the Forward 12-month P/E ratio for the S&P 500 index. The horizontal dashed lines represent the 5-year and 10-year forward P/E averages. The most recent forward P/E was 16.5, compared to the long-term average of 14.1. In other words, if the current P/E ratio corrected to its long-term average, the price of the S&P would decline by almost 15%. If earnings decline further, then price would need to decline further as well.
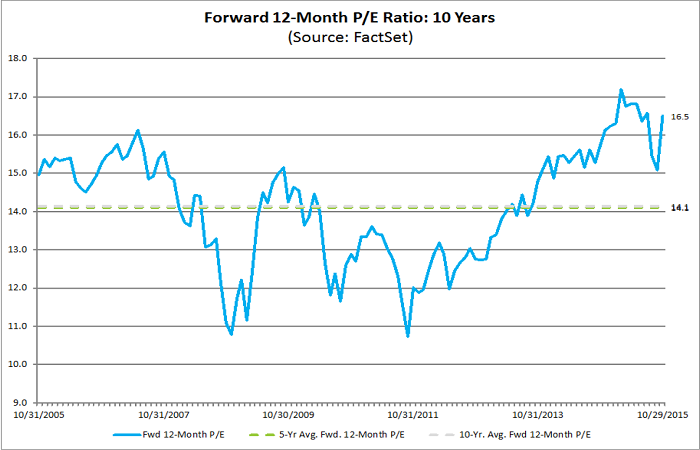
Figure 3: FactSet 12-Month Forward P-E Ratio
We can do the same analysis with historical earnings data. The blue line in Figure 4 below represents the Trailing 12-month P/E ratio for the S&P 500 index. The horizontal dashed lines represents the 5-year and 10-year forward P/E averages. The most recent forward P/E was 18.5, compared to the long-term averages of 15.5 and 15.8. If the current trailing P/E ratio corrected to its long-term averages, the price of the S&P would again decline by approximately 15%. According to historical P/E metrics, the S&P is overvalued by roughly 15%, arguably fueled by extended easy-money Fed policy.

Figure 4: FactSet 12-Month P-E Ratio
Conclusion
Sometimes it pays to get back to basics, and nothing is more basic than analyzing earnings, revenues, and price. Equity earnings and revenues are both declining and are expected to continue to drop. Inexplicably, equity prices are rising and are again approaching all-time highs. You do the math.
Print and Kindle Versions of Brian Johnson's 2nd Book are Available on Amazon (75% 5-Star Reviews)
Exploiting Earnings Volatility: An Innovative New Approach to Evaluating, Optimizing, and Trading Option Strategies to Profit from Earnings Announcements.
Print and Kindle Versions of Brian Johnson's 1st Book are Available on Amazon (79% 5-Star Reviews)
Option Strategy Risk / Return Ratios: A Revolutionary New Approach to Optimizing, Adjusting, and Trading Any Option Income Strategy
Trader Edge Strategy E-Subscription Now Available: 20% ROR
The Trader Edge Asset Allocation Rotational (AAR) Strategy is a conservative, long-only, asset allocation strategy that rotates monthly among five large asset classes. The AAR strategy has generated annual returns of approximately 20% over the combined back and forward test period. Please use the above link to learn more about the AAR strategy.
Brian Johnson
Copyright 2015 - Trading Insights, LLC - All Rights Reserved.
About Brian Johnson
I have been an investment professional for over 30 years. I worked as a fixed income portfolio manager, personally managing over $13 billion in assets for institutional clients. I was also the President of a financial consulting and software development firm, developing artificial intelligence based forecasting and risk management systems for institutional investment managers.
I am now a full-time proprietary trader in options, futures, stocks, and ETFs using both algorithmic and discretionary trading strategies.
In addition to my professional investment experience, I designed and taught courses in financial derivatives for both MBA and undergraduate business programs on a part-time basis for a number of years. I have also written four books on options and derivative strategies.


Earnings and Revenues Decline While Prices Rise
I have written a number of recent articles about the troubling state of the equity markets. There have been many causes for concern: technical, fundamental, valuation, divergences, and global risks, among others. All of these are important, but none are more important than earnings and revenue growth, the prerequisites for sustainable bull markets.
It has been a while since I have written about earnings and revenue growth and the recent trends in both are extremely troubling. FactSet is one of the leading providers of data and analytics and is arguably the best source for information and analysis of equity earnings and revenue trends. FactSet publishes a weekly Earnings Insight report, which is the source for all of the charts and data for this article.
FactSet Earnings and Revenue Data
Here are several key S&P 500 observations from the latest FactSet Earnings Insight report dated October 30, 2015:
To make matters worse, FactSet reports that analysts are predicting earnings and revenue declines of 2.7% and 2.1% for the S&P 500 in Q4 2015.
Earnings versus Price
The above FactSet data indicates that earnings and revenue are both declining and are expected to continue to do so through year-end. What about equity prices? Unfortunately, equity prices have risen. Take a look at Figure 1 below. The dashed green line represents the price of the S&P 500, which rose steadily from 9/30/15 to 10/30/15 (+8%). Conversely, the solid blue line represents the expected Q4 2015 EPS for the S&P 500, which dropped by roughly 2.5% over the same period. That's right, prices rose 8% while expected earnings declined by 2.5%. Not a good combination.
Figure 1: FactSet Change in EPS vs Price Q4 2015
Similarly, the chart in Figure 2 below illustrates the long-term behavior of price and the 12-month forward EPS for the S&P 500. The relationship between price and EPS is very consistent until mid-2013, when the price of the S&P 500 began to grow much faster than the growth rate in EPS. Price increases that are not supported by earnings growth are not sustainable.
Figure 2: FactSet Change in Forward EPS vs Price
P/E Ratios Increase
When price increases are not supported by earnings growth, price-earnings (P/E) ratios increase. In this environment, investors are willing to pay higher prices for the same dollar of earnings. When P/E ratios are below long-term averages, P/E expansion is benign. However, when P/E ratios are significantly above long-term averages and P/E ratios expand further, that is real cause for concern.
The blue line in Figure 3 below represents the Forward 12-month P/E ratio for the S&P 500 index. The horizontal dashed lines represent the 5-year and 10-year forward P/E averages. The most recent forward P/E was 16.5, compared to the long-term average of 14.1. In other words, if the current P/E ratio corrected to its long-term average, the price of the S&P would decline by almost 15%. If earnings decline further, then price would need to decline further as well.
Figure 3: FactSet 12-Month Forward P-E Ratio
We can do the same analysis with historical earnings data. The blue line in Figure 4 below represents the Trailing 12-month P/E ratio for the S&P 500 index. The horizontal dashed lines represents the 5-year and 10-year forward P/E averages. The most recent forward P/E was 18.5, compared to the long-term averages of 15.5 and 15.8. If the current trailing P/E ratio corrected to its long-term averages, the price of the S&P would again decline by approximately 15%. According to historical P/E metrics, the S&P is overvalued by roughly 15%, arguably fueled by extended easy-money Fed policy.
Figure 4: FactSet 12-Month P-E Ratio
Conclusion
Sometimes it pays to get back to basics, and nothing is more basic than analyzing earnings, revenues, and price. Equity earnings and revenues are both declining and are expected to continue to drop. Inexplicably, equity prices are rising and are again approaching all-time highs. You do the math.
Print and Kindle Versions of Brian Johnson's 2nd Book are Available on Amazon (75% 5-Star Reviews)
Exploiting Earnings Volatility: An Innovative New Approach to Evaluating, Optimizing, and Trading Option Strategies to Profit from Earnings Announcements.
Print and Kindle Versions of Brian Johnson's 1st Book are Available on Amazon (79% 5-Star Reviews)
Option Strategy Risk / Return Ratios: A Revolutionary New Approach to Optimizing, Adjusting, and Trading Any Option Income Strategy
Trader Edge Strategy E-Subscription Now Available: 20% ROR
The Trader Edge Asset Allocation Rotational (AAR) Strategy is a conservative, long-only, asset allocation strategy that rotates monthly among five large asset classes. The AAR strategy has generated annual returns of approximately 20% over the combined back and forward test period. Please use the above link to learn more about the AAR strategy.
Brian Johnson
Copyright 2015 - Trading Insights, LLC - All Rights Reserved.
About Brian Johnson
I have been an investment professional for over 30 years. I worked as a fixed income portfolio manager, personally managing over $13 billion in assets for institutional clients. I was also the President of a financial consulting and software development firm, developing artificial intelligence based forecasting and risk management systems for institutional investment managers. I am now a full-time proprietary trader in options, futures, stocks, and ETFs using both algorithmic and discretionary trading strategies. In addition to my professional investment experience, I designed and taught courses in financial derivatives for both MBA and undergraduate business programs on a part-time basis for a number of years. I have also written four books on options and derivative strategies.