This article presents the Trader Edge aggregate neural network model forecast for the October 2015 non-farm payroll data, which is scheduled to be released tomorrow morning at 8:30 AM EST.
Non-Farm Payroll (NFP) Model Forecast - October 2015
The Trader Edge aggregate NFP model represents the average of three neural network forecasting models, each of which employs a different neural network architecture. Unlike expert systems, neural networks use algorithms to identify and quantify complex relationships between variables based on historical data. All three models derive their forecasts from seven explanatory variables and the changes in those variables over time.
The table in Figure 1 below includes the monthly non-farm payroll data for two months: September and October 2015. The September data was released last month and the non-farm payroll data for October 2015 will be released tomorrow morning at 8:30 AM EST.
The model forecasts are in the third data row of the table (in blue). Note that past and current forecasts reflect the latest values of the independent variables, which means that forecasts will change when revisions are made to the historical economic data.
The monthly standard error of the model is approximately 76,600 jobs. The first and last data rows of the table report the forecast plus 0.5 standard errors (in green) and the forecast minus 0.5 standard errors (in red), respectively. All values are rounded to the nearest thousand. If the model errors were normally distributed, roughly 31% of the observations would fall below -0.5 standard errors and another 31% of the observations would exceed +0.5 standard errors.
The actual non-farm payroll release for September 2015 is in the second data row of the table (in purple). The consensus estimate (reported by Briefing.com) for October 2015 is also in the second data row of the table (in purple). The reported and consensus NFP values also include the deviation from the forecast NFP (as a multiple of the standard error of the estimate). Finally, the last column of the table includes the estimated changes from September 2015 to October 2015.
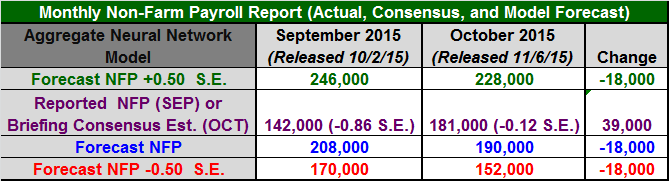
Figure 1: Non-Farm Payroll Table October 2015
Model Commentary
The aggregate neural network model forecast for October is 190,000, which is down from last month's revised forecast of 208,000, reflecting a decrease in the strength of the employment environment during the month of October. The Briefing.com consensus estimate for October is 181,000, which is 39,000 higher than the September NFP data (142,000), suggesting a strengthening in the employment environment. The actual September data was materially below the revised September forecast (-0.86 S.E.) and the consensus estimate for October is slightly below the model forecast (-0.12 S.E.).
If we ignore the large NFP outliers, there had been a gradual and sustained positive trend in the employment data from mid-2012 through late 2014. The trend is easier to see in the forecast data due to fewer outliers. The positive trend in the model forecasts definitely leveled off in early 2015 and has now reversed. The trend in employment growth has definitely weakened over the past few months and is much weaker than late 2014. This is evident in both the forecast and actual NFP data.
The difference between the October NFP consensus and October NFP forecast is modest, which does not suggest a high likelihood of a material surprise tomorrow. However, the actual NFP data for August and September were well below forecast. These types of outliers tend to be reversed in subsequent months, which could lead to an artificially high NFP data point for October.
The most important point is that the model indicates that the employment environment is continuing to weaken, which contradicts the market's expectation. If an artificially high NFP observation is released tomorrow, it could convince the Fed to raise rates at its next meeting. One (hypothetical) bad data point could have significant monetary policy implications.
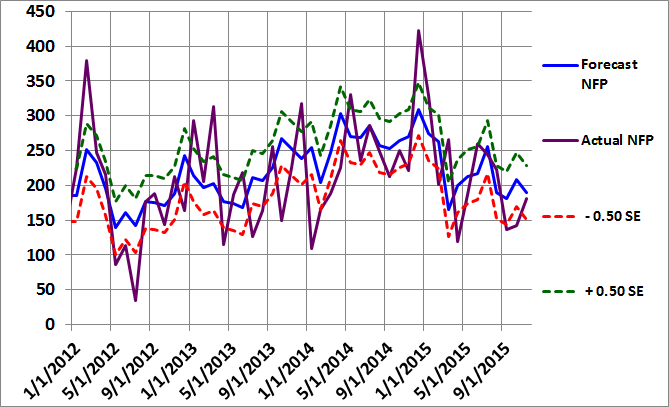
Figure 2: Non-Farm Payroll Graph October 2015
Summary
Basic forecasting tools can help you identify unusual consensus economic estimates, which often lead to substantial surprises and market movements. Identifying such environments in advance may help you protect your portfolio from these corrections and help you determine the optimal entry and exit points for your strategies.
In the case of the NFP data, the monthly report data is highly variable and prone to substantial revisions. As a result, having an independent and unbiased indicator of the health of the U.S. job market is especially important.
Print and Kindle Versions of Brian Johnson's 2nd Book are Available on Amazon (75% 5-Star Reviews)
Exploiting Earnings Volatility: An Innovative New Approach to Evaluating, Optimizing, and Trading Option Strategies to Profit from Earnings Announcements.
Print and Kindle Versions of Brian Johnson's 1st Book are Available on Amazon (79% 5-Star Reviews)
Option Strategy Risk / Return Ratios: A Revolutionary New Approach to Optimizing, Adjusting, and Trading Any Option Income Strategy
Trader Edge Strategy E-Subscription Now Available: 20% ROR
The Trader Edge Asset Allocation Rotational (AAR) Strategy is a conservative, long-only, asset allocation strategy that rotates monthly among five large asset classes. The AAR strategy has generated annual returns of approximately 20% over the combined back and forward test period. Please use the above link to learn more about the AAR strategy.
Brian Johnson
Copyright 2015 - Trading Insights, LLC - All Rights Reserved.
About Brian Johnson
I have been an investment professional for over 30 years. I worked as a fixed income portfolio manager, personally managing over $13 billion in assets for institutional clients. I was also the President of a financial consulting and software development firm, developing artificial intelligence based forecasting and risk management systems for institutional investment managers.
I am now a full-time proprietary trader in options, futures, stocks, and ETFs using both algorithmic and discretionary trading strategies.
In addition to my professional investment experience, I designed and taught courses in financial derivatives for both MBA and undergraduate business programs on a part-time basis for a number of years. I have also written four books on options and derivative strategies.


Non-Farm Payroll (NFP) Model Forecast – October 2015
This article presents the Trader Edge aggregate neural network model forecast for the October 2015 non-farm payroll data, which is scheduled to be released tomorrow morning at 8:30 AM EST.
Non-Farm Payroll (NFP) Model Forecast - October 2015
The Trader Edge aggregate NFP model represents the average of three neural network forecasting models, each of which employs a different neural network architecture. Unlike expert systems, neural networks use algorithms to identify and quantify complex relationships between variables based on historical data. All three models derive their forecasts from seven explanatory variables and the changes in those variables over time.
The table in Figure 1 below includes the monthly non-farm payroll data for two months: September and October 2015. The September data was released last month and the non-farm payroll data for October 2015 will be released tomorrow morning at 8:30 AM EST.
The model forecasts are in the third data row of the table (in blue). Note that past and current forecasts reflect the latest values of the independent variables, which means that forecasts will change when revisions are made to the historical economic data.
The monthly standard error of the model is approximately 76,600 jobs. The first and last data rows of the table report the forecast plus 0.5 standard errors (in green) and the forecast minus 0.5 standard errors (in red), respectively. All values are rounded to the nearest thousand. If the model errors were normally distributed, roughly 31% of the observations would fall below -0.5 standard errors and another 31% of the observations would exceed +0.5 standard errors.
The actual non-farm payroll release for September 2015 is in the second data row of the table (in purple). The consensus estimate (reported by Briefing.com) for October 2015 is also in the second data row of the table (in purple). The reported and consensus NFP values also include the deviation from the forecast NFP (as a multiple of the standard error of the estimate). Finally, the last column of the table includes the estimated changes from September 2015 to October 2015.
Figure 1: Non-Farm Payroll Table October 2015
Model Commentary
The aggregate neural network model forecast for October is 190,000, which is down from last month's revised forecast of 208,000, reflecting a decrease in the strength of the employment environment during the month of October. The Briefing.com consensus estimate for October is 181,000, which is 39,000 higher than the September NFP data (142,000), suggesting a strengthening in the employment environment. The actual September data was materially below the revised September forecast (-0.86 S.E.) and the consensus estimate for October is slightly below the model forecast (-0.12 S.E.).
If we ignore the large NFP outliers, there had been a gradual and sustained positive trend in the employment data from mid-2012 through late 2014. The trend is easier to see in the forecast data due to fewer outliers. The positive trend in the model forecasts definitely leveled off in early 2015 and has now reversed. The trend in employment growth has definitely weakened over the past few months and is much weaker than late 2014. This is evident in both the forecast and actual NFP data.
The difference between the October NFP consensus and October NFP forecast is modest, which does not suggest a high likelihood of a material surprise tomorrow. However, the actual NFP data for August and September were well below forecast. These types of outliers tend to be reversed in subsequent months, which could lead to an artificially high NFP data point for October.
The most important point is that the model indicates that the employment environment is continuing to weaken, which contradicts the market's expectation. If an artificially high NFP observation is released tomorrow, it could convince the Fed to raise rates at its next meeting. One (hypothetical) bad data point could have significant monetary policy implications.
Figure 2: Non-Farm Payroll Graph October 2015
Summary
Basic forecasting tools can help you identify unusual consensus economic estimates, which often lead to substantial surprises and market movements. Identifying such environments in advance may help you protect your portfolio from these corrections and help you determine the optimal entry and exit points for your strategies.
In the case of the NFP data, the monthly report data is highly variable and prone to substantial revisions. As a result, having an independent and unbiased indicator of the health of the U.S. job market is especially important.
Print and Kindle Versions of Brian Johnson's 2nd Book are Available on Amazon (75% 5-Star Reviews)
Exploiting Earnings Volatility: An Innovative New Approach to Evaluating, Optimizing, and Trading Option Strategies to Profit from Earnings Announcements.
Print and Kindle Versions of Brian Johnson's 1st Book are Available on Amazon (79% 5-Star Reviews)
Option Strategy Risk / Return Ratios: A Revolutionary New Approach to Optimizing, Adjusting, and Trading Any Option Income Strategy
Trader Edge Strategy E-Subscription Now Available: 20% ROR
The Trader Edge Asset Allocation Rotational (AAR) Strategy is a conservative, long-only, asset allocation strategy that rotates monthly among five large asset classes. The AAR strategy has generated annual returns of approximately 20% over the combined back and forward test period. Please use the above link to learn more about the AAR strategy.
Brian Johnson
Copyright 2015 - Trading Insights, LLC - All Rights Reserved.
About Brian Johnson
I have been an investment professional for over 30 years. I worked as a fixed income portfolio manager, personally managing over $13 billion in assets for institutional clients. I was also the President of a financial consulting and software development firm, developing artificial intelligence based forecasting and risk management systems for institutional investment managers. I am now a full-time proprietary trader in options, futures, stocks, and ETFs using both algorithmic and discretionary trading strategies. In addition to my professional investment experience, I designed and taught courses in financial derivatives for both MBA and undergraduate business programs on a part-time basis for a number of years. I have also written four books on options and derivative strategies.