I introduced the Option Income Strategy Universal Filter (OISUF) in my recent article Option Income Strategy Trade Filters: An In-Depth Article Demonstrating the Use of Trade Filters to Enhance Returns and Reduce Risk. The article and the proprietary OISUF algorithm represent the culmination of years of research into developing a systematic framework for optimizing the timing of Option Income Strategy (OIS) trades. The copyrighted information in this section appeared in Chapter 5 of the article. I encourage you to read the article for a more detailed explanation of trade filters that can be applied to option income strategy trades.
The published performance results were based on the analysis of 15,434 iron condor trades, each with a comprehensive set of objective, tradable entry and exit rules. The results for each of the 15,000 plus trades were scaled to a constant dollar amount at risk, to ensure all trades were equally-weighted when calculating the performance metrics.
I ran the back-tests using end-of-day data on options with monthly expiration dates from May 2004 to May 2016. The back-test results were all based on actual option prices.
QuantyCarlo
The software that I used to conduct the back-tests is called QuantyCarlo, which was developed by Iota Technologies; many thanks to Larry Richards and Iota Technologies for their permission to publish screen shots and back-test results from their software.
The technology that allows automated option strategy back-testing was not available until recently. I originally heard about QuantyCarlo through one of my readers and I was fortunate to be one of the first subscribers. QuantyCarlo subscriptions may eventually be available through OptionVue. For more information about discounts on QuantyCarlo and other qualifying OptionVue products and services, click on the OptionVue image link in the right sidebar.
Option Income Strategy Universal Filter (OISUF)
My QuantyCarlo research confirmed that managed iron condor trades have been profitable historically, even when entered indiscriminately, with no attempt to identify or capitalize on optimal entry conditions. In fact, many traders use a similar unfiltered monthly or weekly campaign approach, dutifully entering new option income positions every month or every week, irrespective of the market environment.
There is nothing inherently wrong with this approach; properly managed, monthly option income campaigns should deliver excess returns. However, it is possible to use market-edge hypotheses and discriminating filters to systematically identify superior trading environments.
The OIS Universal Filter (OISUF) is a standardized metric calculated by an algorithm that exclusively uses historical and current prices and implied volatilities. The volatility index is used as a proxy for implied volatility, which limits the application of the OISUF to underlying securities that have corresponding volatility indices.
The OISUF algorithm has very few parameters. It captures the fundamental relationships between price, implied volatility, and OIS performance. It was not derived from a specific dataset and the parameters were not optimized. As a result, the parameters in the algorithm will never change and will never be re-estimated. The limited number of non-optimized parameters greatly enhances the robustness of the OISUF.
Optimizing a large number of parameters to maximize in-sample strategy performance is essentially data-mining, which greatly magnifies the risk of identifying spurious correlations instead of meaningful exploitable relationships - relationships that will persist in the future. If we examine enough parameter combinations, we will always find a few that generated excess returns in the historical dataset.
Unfortunately, most of these optimized strategies that rely on over-fitted parameter combinations fail miserably in subsequent periods. This is why I always develop a well-reasoned market-edge hypothesis first, then test the historical results against the hypothesis, and only allocate capital to strategies that generate results that are consistent with the initial hypothesis.
Unlike strategies that employ data-mining techniques to optimize a large number of parameter values, the OISUF algorithm was derived directly from the market-edge hypothesis. The OISUF uses very few parameters and the parameter values were not optimized. Instead, the parameter values were structural and were chosen before strategy testing. Structural means the OISUF parameter values were a byproduct of the market-edge hypothesis itself. They were the only parameter values tested. Despite the use of structural, pre-determined parameter values, the OISUF algorithm is very responsive to changing market conditions. It can be used to systematically quantify the attractiveness of OIS trade entry environments in real time.
I call it the OIS Universal Filter because it can be applied to enhance the risk-adjusted returns of option income strategies almost universally. It is applicable to any Delta-neutral option income strategy that does not require time (calendar) spread components. This includes the butterfly, iron-butterfly, condor, iron condor, road trip, weirdor, kevlar, jeep, and many other exotic hybrid strategies. Despite the wide range of OISUF applicable strategies, they will all have negative Gamma, positive Theta, and negative Vega by definition.
As an aside, time and diagonal spreads require selling near-term options and purchasing longer-term options to generate positive Theta. As a result, the performance of time-spread strategies is heavily dependent on the term structure of volatilities. As a result, time spreads are actually directional volatility strategies, which require a unique type of trade entry filter. These time-spread-specific filters are fascinating, but are beyond the scope of this article.
The OIS Universal Filter will yield the best results when applied to option income strategies that respond gradually to changes in the price of the underlying security (those with relatively flat T+0 lines) and are profitable over a wide range of underlying security prices at option expiration. As already mentioned, the strategies should also employ minimal adjustments.
OISUF Performance Metrics
The OIS Universal Filter algorithm produces a standardized OIS score. In this context, the word “standardized” means the resulting OIS scores are directly comparable across all underlying securities. OIS scores are not bounded, but typically fall between negative 200 and positive 100.
Scores below zero indicate unfavorable OIS environments and scores above zero signify favorable OIS environments. Furthermore, higher OIS scores imply more advantageous OIS environments across the entire spectrum of prospective OIS values. For example, an OIS score of 100 should generate better risk-adjusted returns than a score of 60, than a score of 20, than a score of negative 20, than a score of negative 60. The greater the deviation of the OIS scores from zero (positive or negative), the more significant the expected performance difference from the unfiltered trade data.
Let’s review the OISUF performance metrics in Figure 5.1. The term “1TPS” in the table title means one trade per signal, which generated a new managed iron condor trade every day on the RUT, SPX, and NDX, provided the specific filter conditions were met.
The first two columns on the left-side of Figure 5.1 describe the OISUF condition. For OIS score threshold values of less than zero, the filter condition required OIS scores to be less than or equal to the threshold value. For OIS score threshold values of greater than or equal to zero, the filter condition required OIS scores to be greater than or equal to the threshold value. As the OIS score threshold deviated further from zero, the conditions became increasingly restrictive.
The next three columns show the performance metrics (profit factor, percentage of winning trades, and average return on margin) for each filter condition. The final column documents the percentage of the 15,434 managed iron condor trades that met the OISUF conditions.
To facilitate comparison with the filtered results, the first row in Figure 5.1 shows the performance metrics for all 15,434 unfiltered iron condor trades. The unfiltered managed iron condor strategy performed well historically. The unfiltered profit factor was 2.10 (2.10 dollars of gains per dollar of losses). In addition, 85.10% of the unfiltered trades were profitable and the average return on margin was 3.22%.
Beginning at the top of the table, OIS score thresholds of less than or equal to negative 120 produced unprofitable trades. In other words, the profit factors were all less than 1.0 and the average returns on margin were all negative. This is what we would expect for the worst (most negative) OIS scores and is consistent with the market-edge hypothesis.
OIS score thresholds of negative 100 to negative 20 produced profitable iron condor trades and profitability increased as the OIS score increased. We would expect to see increasing profitability as a function of rising OIS scores. However, should the iron condor strategy be profitable in this region of negative OIS scores? Why would that be the case?
* * *
The iron condor strategy was still profitable in this region because of the inherent profitability of option income strategies, particularly when these strategies are employed using chronically overvalued options on the equity indices. Instead of comparing the results to a break-even baseline, the results should be compared to the unfiltered performance metrics. In other words, how did the results for OIS score thresholds of negative 100 to negative 20 compare to the unfiltered trade results?
As we would expect, the negative OIS thresholds produced worse results than the unfiltered trades. For every filter condition in this region, the profit factor, percentage of winning trades, and return on margin were worse (lower) than the unfiltered performance metrics.
The opposite was true for all OIS score thresholds above zero. In every such case, the profit factor, percentage of winning trades, and average return on margin exceeded the unfiltered performance metrics. The metrics improved as the OIS score threshold increased. The performance metrics for OIS scores of 40, 60, 80, and 100 were exceptional: profit factors from 5.15 to 20.69, 92.89% to 98.36% winning trades, and average returns of 5.53% to 8.13%.
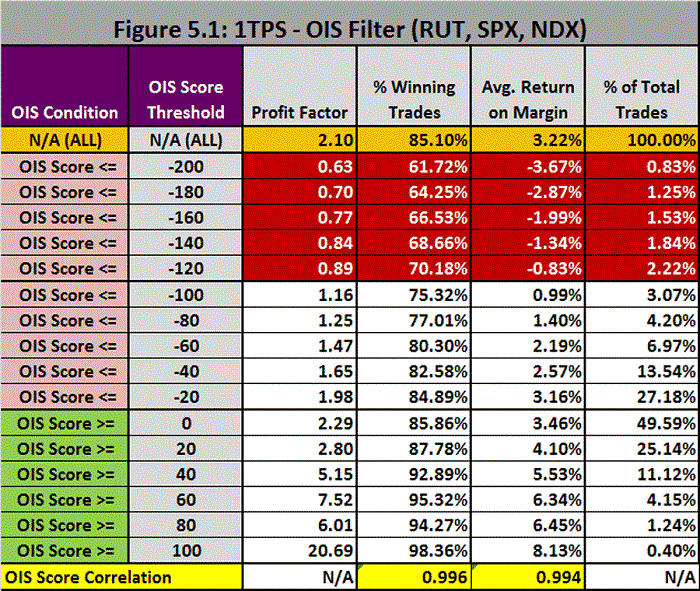
Figure 5.1
As was the case for negative OIS scores, all three performance metrics were an increasing function of the OIS scores for positive OIS thresholds. In fact, there was only a single case when the performance metrics did not increase for a corresponding increase in OIS score. This occurred for an OIS score threshold of 80. This is likely the result of the small number of trades in this region.
Despite this minor inconsistency, the correlation between the OIS score threshold and the percentage of winning trades was 0.996. The correlation between the OIS score threshold and the average return on margin was 0.994. Both performance metrics were almost perfectly positively correlated with the OIS score threshold.
There is a lot of data in Figure 5.1 and it can be challenging to grasp all of the data relationships from tabular data. As a result, I also created four charts that illustrate the same data graphically. Figure 5.2 shows the relationship between profit factor and the OIS score threshold. As you will recall, a profit factor of 1.0 represents break-even. The profit factor formula is not a linear function of profitability, which is why the profit factor increases sharply at high OIS values.
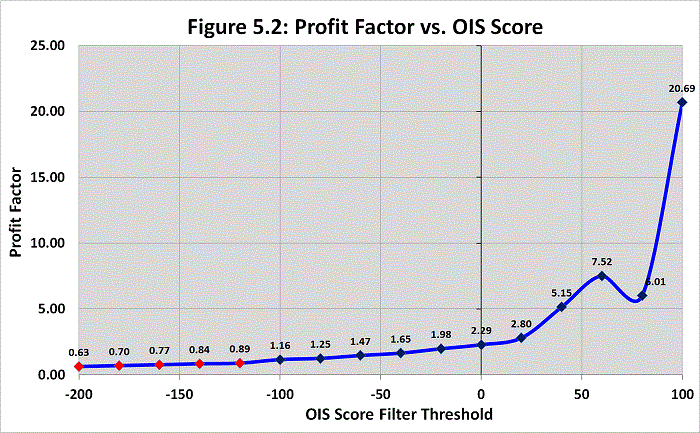
Figure 5.2
Figure 5.3 demonstrates the relationship between the percentage of winning trades and the OIS score threshold. As you can see from the graph, the relationship is almost linear, which is consistent with the very high OIS score correlation of 0.996.
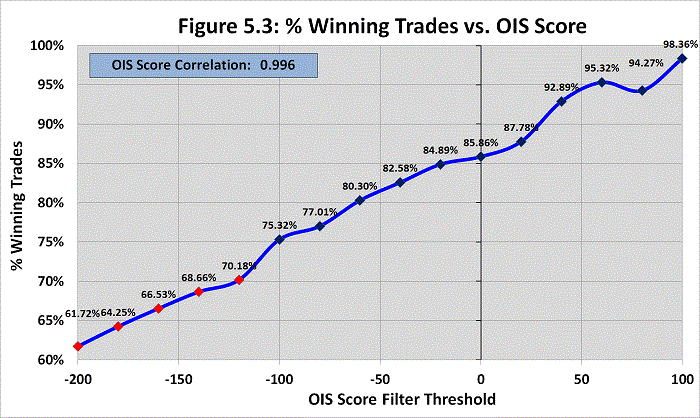
Figure 5.3
Figure 5.4 illustrates the relationship between the average return on margin and the OIS score threshold. As was the case for the percentage of winning trades, the relationship is almost linear, which is consistent with the very high OIS score correlation of 0.994.
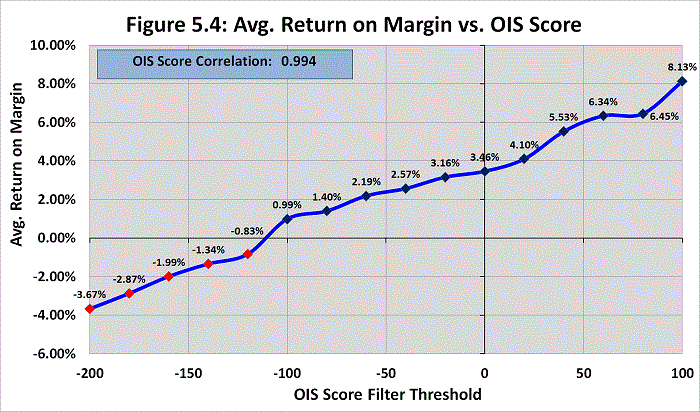
Figure 5.4
Finally, Figure 5.5 shows the percentage of total trades that met the OISUF criteria as a function of the OIS score threshold. The OIS median value was very close to zero. As the OIS score threshold deviated from zero, the conditions became increasingly restrictive, resulting in fewer passing trades.
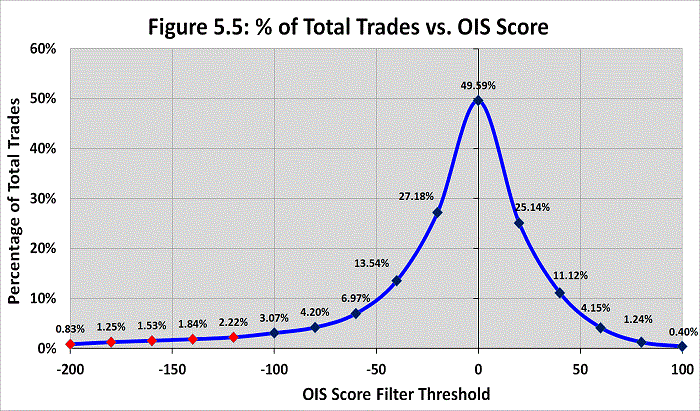
Figure 5.5
OIS Universal Filter Conclusions
As I already explained, the OISUF algorithm has very few parameters. It captures the fundamental relationships between price, implied volatility, and OIS performance. It was not derived from a specific dataset and the parameters were not optimized. As a result, the parameters in the algorithm will never change and will never be re-estimated. The parameter values were structural and were chosen before strategy testing and they were the only parameter values tested. The limited number of non-optimized parameters greatly enhances the robustness of the OISUF.
The very high correlations between the OIS score threshold and performance metrics (Figure 5.1) and the outstanding performance of the OISUF as a stand-alone filter provide compelling evidence in support of its market-edge hypothesis and the corresponding OISUF algorithm.
Furthermore, the structural independence of the OISUF from other technical and fundamental filters makes it possible to combine the OISUF with other filters to deliver results that are superior to individual filters. Surprisingly, this was even possible for filters that were largely ineffective in enhancing the iron condor strategy performance metrics individually.
The OISUF performance metrics are extremely promising, suggesting that the OISUF can be used by traders with diverse risk/return preferences to customize their option income strategy entry and exit requirements.
Expanding the use of the OISUF algorithm to time entries, exits, and adjustments creates an objective OIS trade management system that is applicable throughout the life of every trade. I personally use the OISUF in conjunction with other filters to reduce the risks and enhance the returns of all of my option income strategies.
OISUF Subscriptions
Trading Insights LLC may limit the number of OISUF subscribers at its own discretion. The proprietary OISUF algorithm is run via macros in an Excel spreadsheet, which requires a one-time download. The spreadsheet is simple to use and has built-in macros to import free (as of this writing) Yahoo (price) and CBOE (IV) data. Data from alternative sources can also be copied and pasted as desired.
There are both non-professional and professional OISUF e-subscriptions available. The monthly subscription cost is $59 for non-professionals (individual investors) and $590 for professionals (banks, hedge funds, insurance companies, registered investment advisers, CTAs, mutual funds, endowments, pension plans, etc.). All fees are paid in advance via PayPal.
The OISUF subscription is governed by a disclaimer and terms and conditions, which must be accepted prior to using the OISUF algorithm. The PayPal buttons below will route you to PayPal to complete the order. Once completed, you will be routed back to the Trader Edge site to complete the registration process. Please complete the registration immediately upon returning, to ensure ongoing access to the OISUF restricted area of the site.
Recent Changes in Availability of Free Data
When I created the OISUF and AIVE platforms, free historical daily price and IV data were available for download (export) from Yahoo and the CBOE respectively. The OISUF and AIVE platforms both have macros to import the exported Yahoo and CBOE data from exported .csv files. While the VIX data is still available for download on the CBOE site (https://www.cboe.com/tradable_products/vix/vix_historical_data/), the free historical downloads for the RVX and VXN data are not currently available on the CBOE site. Similarly, Yahoo is not currently offering free downloads for index price data. Unless and until this changes, it will not be possible to use the Yahoo and CBOE macros in the OISUF and AIVE platforms to import the historical data.
Fortunately, the AIVE platform has a separate set of macros designed to read both price and IV data from CSI, a third-party data vendor. In addition, it is always possible to copy and paste historical price and IV data from any source, directly into the OISUF and AIVE platforms.
Non-Professional:OIS Universal Filter E-Subscription: $59 / mo.
PROFESSIONAL:OIS Universal Filter E-Subscription: $590 / mo.
If you have any questions about the OISUF e-subscription, or you encounter any problems during the payment or registration process, please contact me via email: BJohnson@TraderEdge.Net.
I look forward to working with you.
Brian Johnson
Copyright 2016 - Trading Insights, LLC - All Rights Reserved.


