Volatility is arguably the single most important option concept, effectively determining the price of almost every derivatives instrument. The AI Volatility Edge platform uses the latest in machine learning algorithms to identify and quantify real-time volatility pricing anomalies that can be exploited with strategies based on SPX, NDX, and RUT index options, VIX futures, and VIX options. The AI Volatility Edge (AIVE) platform provides forecasts and relative value analysis across the entire term structure of volatilities.
Why is volatility so important? Because volatility is synonymous with the value of the option. If you could forecast the future distribution of returns, you would be able to estimate the current value of every option. If you could forecast implied volatility (IV - the market’s estimate of volatility) in the future, you would be able to estimate the future value of volatility indices and the future value of every option. If your estimates of the future return distribution and future implied volatilities diverged materially from the market’s estimates, you could design option and volatility index futures strategies to exploit those targeted pricing anomalies and earn excess risk-adjusted returns.
I have studied, researched, and modeled volatility for my entire 30+ year career as an investment professional: institutional investment manager, Professor of Practice, and proprietary trader. Forecasting future volatility is an extremely complex challenge.
I have devoted the last year to designing a comprehensive option volatility forecasting platform called AI Volatility Edge - which is an integrated collection of AI models based on the latest machine-learning (ML) algorithms. The AI Volatility Edge platform is available on a subscription basis for professional and non-professional traders.
Please see the AI Volatility Edge product page for a comprehensive explanation of the AI Volatility Edge platform, detailed analysis of AIVE forecasts, additional trade examples, and ordering links.
AI Models
I have extensive experience with Artificial Intelligence (AI) models, dating back to the late-1990s. During that time, I developed and licensed a suite of neural network models (including a volatility model) used by professional investment managers, including hedge funds, international banks, and mutual fund companies.
AI models are extremely powerful – perhaps too powerful. Without expert oversight and design, they will overfit the training data – essentially memorizing the data, rather than generalizing the underlying data relationships. The resulting models will fail in practice, which is very costly in financial modeling. I used the insights gained from 20+ years of AI modeling to force the AIVE models to generalize (and not simply memorize the data):
- Limited number of cause-and-effect explanatory variables (fewer than 10),
- Same variables for every model,
- Testing/Validation data set much larger than training set,
- Single aggregate model for SPX, NDX, and RUT (tripled size of data set),
- Severely limited number of training/optimization iterations, and
- Volatility forecasts are weighted-averages of several AI models.
AI Volatility Edge (AIVE)
The interpretation of the AIVE volatility forecasts is straightforward. If volatility forecasts were higher than anticipated, volatility would be expected to rise (suggesting long volatility strategies) and vice versa.
The AI Volatility Edge platform forecasts four different types of future volatility (explained in detail below): annualized Realized Volatility (RV), Volatility index prices (VX), Realized Terminal Volatility (RTV), and Realized Extreme Volatility (REV), each for a specific number of trade days into the future: 0, 5, 10, 15, 21, 31, 42, 63, 84, 105, 126, 189, 252, and 504. The RV, VX, and RTV forecasts are derived from 80 different AI models (three for each time period and type of volatility). The Realized Extreme Volatility forecast is estimated using a regression model based on the AI model forecasts.
Realized Volatility (RV) is the annualized volatility derived from the daily returns of the underlying equity index over a specified number of trading days in the future. It can be compared directly to the implied volatility of at-the-money (ATM) options.
If realized volatility forecasts were higher than the at-the-money (ATM) volatilities of the equity index options, then ATM options would potentially be undervalued. In this environment, positive Gamma strategies would be desirable to capitalize on higher than expected realized volatility. If the realized volatility forecasts were lower than the volatilities of ATM equity index options, then ATM options would potentially be overvalued, which would suggest negative Gamma/Positive Theta strategies.
The AI Volatility Edge platform also forecasts the volatility index prices (VX) a specified number of trading days into the future. These values are directly comparable to the current prices of volatility index futures contracts on the corresponding expiration dates.
If volatility index forecasts were higher than volatility index futures prices, then volatility index futures would potentially be undervalued. Since volatility index prices are derived from actual options, this is equivalent to saying that implied volatilities would be expected to rise more than anticipated, which would advocate positive Vega strategies. If the volatility index forecasts were lower than volatility index futures prices, then volatility index futures would potentially be overvalued. In this environment, future implied volatilities would be lower than expected, which would suggest negative Vega strategies. Obviously, volatility index futures or options on volatility index futures could also be used to capitalize on these prospective VX anomalies as well.
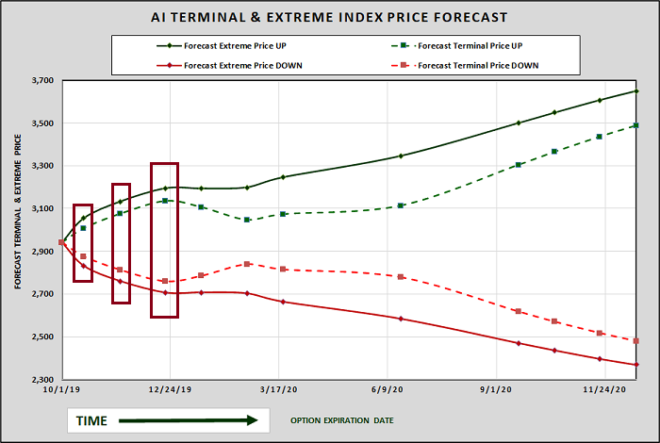
The AI Volatility Edge platform also forecasts Realized Terminal Volatility (RTV), which represents the expected continuously compounded percentage price change of the underlying equity index from the analysis date to the end of the specified period in the future. These return forecasts are not annualized and are not directional. In other words, a 21-trade day RTV forecast of 4% would imply an expected price change of plus or minus 4% (continuously compounded) from now until the close, 21 trading days in the future.
The Realized Extreme Volatility (REV) is an estimate of the maximum percentage price change of the underlying equity index at any time during the specified period in the future. As was the case with the Realized Terminal Volatility, the Realized Extreme Volatility forecasts are not annualized and are not directional. If the Realized Terminal Volatility forecast was plus or minus 4% for the next 21 days, the Realized Extreme Volatility forecast might be plus or minus 5.6% (continuously compounded). The RTV and REV are extremely useful when designing option strategies, especially selecting strike prices.
Running the AI Volatility Edge Models
There are only four steps in the AI Volatility Edge Analysis: 1) import the input data, 2) generate the model forecasts, 3) enter the current IV and VX futures data, and 4) analyze the results. I have provided links to two demonstration videos of the AI Volatility Edge Analysis below and I strongly encourage you to review the first video before reading the remainder of this document. Seeing a dynamic demonstration of the spreadsheet, while listening to an explanation would help provide a foundation for the written description that follows.
AI Volatility Edge Video Demo #1: Overview
AI Volatility Edge Video Demo #2: User Interface (I/O)
The AI Volatility Edge models use proprietary variables derived from current and historical equity price and volatility index data to generate their forecasts. The AIVE spreadsheets have macros to import previously downloaded data files from Yahoo and the CBOE or from Commodity Systems Inc. (CSI), the data-vendor that I use for all of my trading and research. There is also an option to enter the intra-day price and volatility index data, to generate real-time volatility forecasts. All of these import options are fully automated with push-button macros in the spreadsheets.
The next step is to choose an analysis date (current or historical) and calculate all of the volatility forecasts – again using a simple push-button macro. The user could quickly compare the volatility forecasts to a specific market implied volatility or volatility index futures price of interest, but it is much more valuable to evaluate the entire term structure of volatilities.
This requires current at-the-money (ATM) implied volatilities for equity options and current volatility index futures data (if available) for the specific equity volatility index
Finally, the Analysis worksheet compares the market IV and futures data with the AI Volatility Edge forecasts in graphical and tabular format to help identify prospective pricing anomalies.
Overpriced Volatility Example
The easiest way to understand the AI Volatility Edge platform is through specific examples (using static screen shots below and in the dynamic video demos). The tables and graphs shown below are an incomplete sample of those available in the AI Volatility Edge spreadsheets. Please see the AIVE product page for more detailed information and for a comprehensive interpretation of the AIVE forecasts with numerous specific trade examples.
The first example uses closing prices from October 1, 2019. Figure 3 below compares the 10/1/2019 AI Realized Volatility forecasts to the implied volatilities for actual S&P 500 equity index options with a range of expiration dates. Using the highlighted row as an example, the ATM S&P 500 option expires on 12/20/2019, 57 trading days in the future. The annualized implied volatility of that option was 16.70% and the annualized Realized Volatility (RV) forecast was only 12.45%. The resulting option was overpriced by 4.25%. Given a standard error of 5.47%, this error equates to a z-score of + 0.78. In other words, the actual implied volatility exceeded the forecast Realized Volatility by 0.78 standard errors. Calculating z-scores for every instrument allows us to compare the relative value across instruments. Finally, a z-score of 0.78 translates to a one-tailed probability (assuming a normal distribution) of 21.9%.
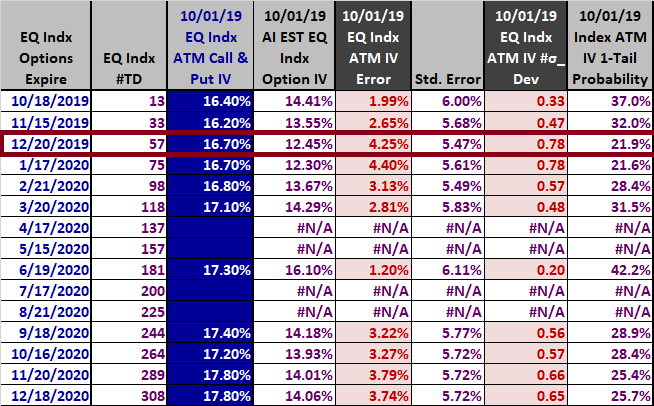
What observations can we make so far? First, the actual implied volatilities exceeded the Realized Volatility forecasts for every ATM option. The entire term structure of ATM implied volatilities was overpriced. Second, the 12/20/2019 expiration was the most overvalued with a z-score of + 0.78. The ATM IV information above is also shown graphically in the AIVE spreadsheets.
This example uses the S&P 500 index, so we also have reliable data for the futures contracts on the corresponding 30-day volatility index – the VIX. Figure 5 below compares the 10/1/2019 AI Volatility Index (VX) forecasts to the VIX futures prices over a range of expiration dates. Using the highlighted row as an example, the VIX futures contract expires on 11/20/2019, 36 trading days in the future. The VIX futures price was 19.18% and the annualized VIX forecast was only 15.90%. The resulting VIX futures contract was overpriced by 3.28%. Given a standard error of 5.14%, this error equates to a z-score of + 0.64. In other words, the actual November 2019 VIX futures price exceeded the 2019 VIX forecast by 0.64 standard errors. Calculating z-scores for every instrument allows us to compare the relative value across instruments. Finally, a z-score of 0.64 translates to a one-tailed probability (assuming a normal distribution) of 26.1%.
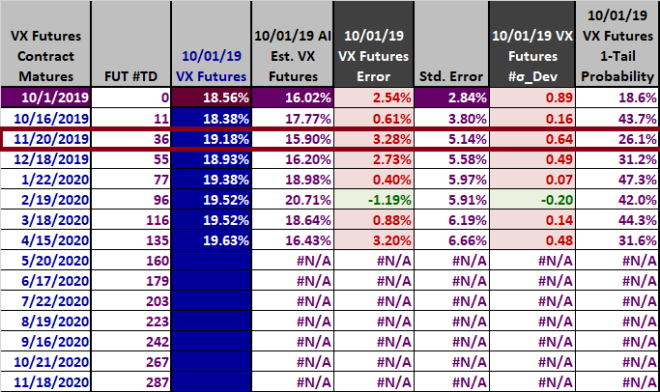
Our observations regarding the VIX futures contracts are similar to the ATM IV analysis. The VIX futures contract prices exceeded the AI VIX futures forecasts for six out of seven futures contracts. The current VIX index value (top row – zero days into the future) also exceeded its forecast. The entire term structure of VIX futures contracts was overpriced. The VIX futures contract expiring on 11/20/2019 was the most overpriced with a z-score of + 0.64. Actually, the current VIX index was more overvalued (higher z-score), but the VIX index itself is not directly tradable. The VX forecast analysis above is also shown graphically in the AIVE spreadsheets.
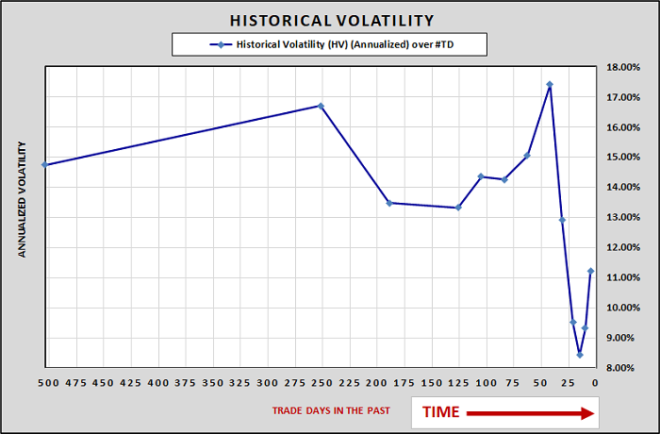
Before we explore specific trades to exploit these prospective pricing anomalies, let’s briefly review the AIVE Historical Volatilities as of 10/1/2019. The historical volatilities for the past five to 504 trade days are illustrated graphically in Figure 7. The values are all annualized, so they are directly comparable. As you can see from the graph, historical volatilities peaked over the past 42 trading days (2 months), then declined sharply before picking up slightly in the last five trading days. Recent volatility had been much lower than the volatilities reflected in ATM options and VIX futures.
Overpriced Volatility Trade Entry
The above analysis strongly suggests that the level of volatility priced into ATM equity options and volatility index (VIX) futures on 10/01/2019 was too high – relative to historical relationships between price, implied volatility, and future volatility. This suggests we should attempt to construct trades that have negative Gamma (and therefore positive Theta), which would benefit from a lower than expected level of Realized Volatility, and negative Vega, which would benefit from a prospective decline in implied volatility.
A detailed analysis of trade entries and exits for several trades is available on the AIVE product page, but below is a brief example of a trade appropriate for the overpriced volatility environment on 10/01/2019.
We have identified S&P 500 options expiring on 12/20/2019 and the VIX futures contract expiring on 11/20/2019 as particularly overvalued, so our proposed strategies will focus on these expiration dates in our example strategies.
Let’s begin with an options trade, a simple broken-wing butterfly (BWF), constructed with a put spread and a call spread. The OptionVue Greeks and graphical analysis as of 10/01/2019 are shown in Figures 8 and 9 below, respectively.

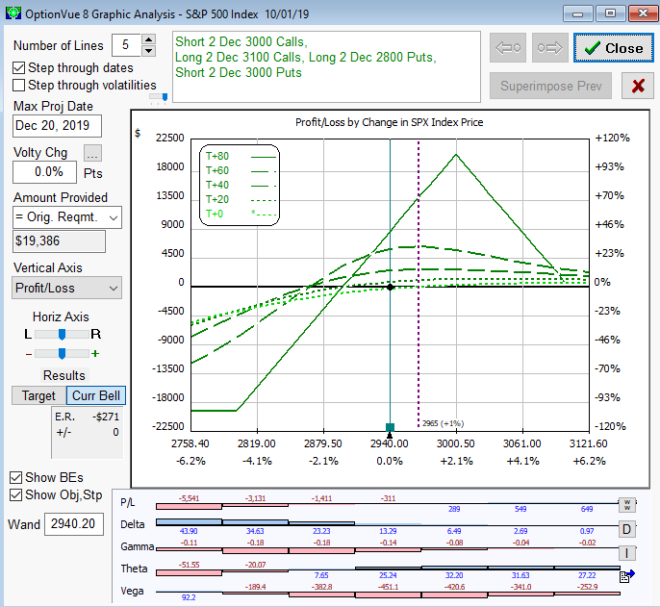
The BWF trade required $19,386 of capital (Reg-T margin) and had the desired negative gamma (-0.13), negative Vega (-464.6) and positive Theta (+25.67), which was consistent with the volatility pricing anomalies implied by the AI Volatility Edge Analysis. You will note the Delta was also slightly positive (+10.4). That was intentional. Volatility and equity prices are strongly negatively correlated. Given that we are forecasting a decline in volatility, that implies the bias will be toward higher equity prices. This is why I constructed a slightly bullish broken-wing butterfly trade, to be consistent with our volatility forecast. However, keep in mind that the volatility models are not directional; they forecast volatility, not price direction. It is up to the individual trader to determine how or when to leverage the historical relationship between price and volatility.
I used the AIVE Realized Terminal and Extreme Volatility price chart (Figure 10) below to estimate the potential magnitude of the price changes when selecting the strikes and designing the BWF strategy.
Overpriced Volatility Trade Exit
A comprehensive AIVE analysis of the proposed trade exit on 11/01/2019 with updated volatility forecasts is provided on the AIVE product page. In the interest of brevity, I will not include the full 11/01/2019 AIVE analysis here. In short, the AIVE models on 11/01/2019 indicated that the volatility pricing anomalies had corrected materially, which significantly reduced the upside in the trade.
In addition, if we look at OptionVue’s graphical analysis (Figure 13) and Greeks (Figure 14) for the BWF trade on 11/01/2019, we also see that we were at the top-end of the sweet-spot of the payoff distribution (which is undesirable) and Delta had turned negative (-14.61), which was inconsistent with the initial overpriced volatility environment.
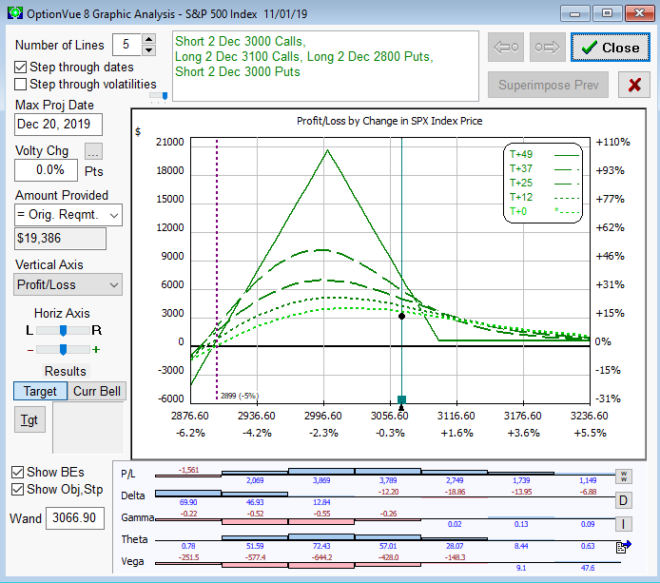

When our edge is gone, we should exit the trade. In this case, the trade would have generated a $3,189 profit over the one-month holding period, representing a return on required capital of 16.45%.
A comprehensive analysis of an underpriced volatility environment, including analysis of trade entries and exits for several trades is also included on the AI Volatility Edge product page.
Summary
Volatility is arguably the single most important option concept, effectively determining the price of every derivatives instrument. The AI Volatility Edge platform uses the latest in machine learning algorithms to identify and quantify real-time volatility pricing anomalies that can be exploited with strategies based on SPX, NDX, and RUT index options, VIX futures, and VIX options. The AI Volatility Edge platform provides forecasts and relative value analysis across the entire term structure of volatilities.
Comprehensive AI Volatility platforms are rare, even at the institutional level. I am not aware of any other AI Volatility platforms designed by experienced investment professionals that are available on a subscription basis to professional or non-professional investors.
If you have previously registered on the Trader Edge site, please use the email link you receive after ordering to register again. Please use a different email address during registration to ensure your AIVE PayPal payment profile is linked to your new registration.
Please note that a NEW version of the AIVE platform is now available and IS compatible with 64-bit versions of Excel!
The original AIVE platform is available for use with 32-bit versions of Excel (even if installed on a 64-bit version of Microsoft Windows).
Please see the AI Volatility Edge product page for a comprehensive explanation of the AI Volatility Edge platform, detailed analysis of AIVE forecasts, additional trade examples, and ordering links.
Recent Changes in Availability of Free Data
When I created the OISUF and AIVE platforms, free historical daily price and IV data were available for download (export) from Yahoo and the CBOE respectively. The OISUF and AIVE platforms both have macros to import the exported Yahoo and CBOE data from exported .csv files. While the VIX data is still available for download on the CBOE site (https://www.cboe.com/tradable_products/vix/vix_historical_data/), the free historical downloads for the RVX and VXN data are not currently available on the CBOE site. Similarly, Yahoo is not currently offering free downloads for index price data. Unless and until this changes, it will not be possible to use the Yahoo and CBOE macros in the OISUF and AIVE platforms to import the historical data.
Fortunately, the AIVE platform has a separate set of macros designed to read both price and IV data from CSI, a third-party data vendor. In addition, it is always possible to copy and paste historical price and IV data from any source, directly into the OISUF and AIVE platforms.
Non-Professional: AI Volatility Edge E-Subscription: $69 / mo.
PROFESSIONAL: AI Volatility Edge E-Subscription: $690 / mo.
If you have any questions about the AI Volatility Edge e-subscription, or you encounter any problems during the payment or registration process, please contact me via email: BJohnson@TraderEdge.Net.
Brian Johnson
Copyright 2020 Trading Insights, LLC. All rights reserved.


Pingback: Recession Model Updates Resume Next Month: 12-01-2020 | Trader Edge
Pingback: 64-Bit AI Volatility Edge Platform Now Available! | Trader Edge
Pingback: Recession Model Forecast: 12-01-2020 | Trader Edge
Pingback: Trading Option Volatility Featured in Stocks & Commodities Magazine | Trader Edge
Pingback: Recession Model Forecast: 03-01-2022 | Trader Edge
Pingback: Recession Model Forecast: 10-1-2022 | Trader Edge