
In the past, I published the Trader Edge Recession Models every month. After finalizing and rolling out the 32-bit and 64-bit versions of a new comprehensive option volatility forecasting platform called AI Volatility Edge (AIVE) and publishing my latest book (Trading Option Volatility), I have been focusing exclusively on my trading and proprietary research. As a result, I suspended the regular monthly recession model publication.
Due to global central bank intervention, rapid inflation, rising interest rates, and deteriorating conditions across many markets, a number of readers have asked me to publish a new recession model update. Below is the latest recession model update as of October 1, 2022. Please note a new AI model designed to identify the 6-month period following the trough in the SPX, associated with an NBER recession.
Monthly Update
This article updates the diffusion indices, recession slack index, aggregate recession model, aggregate peak-trough model, and AI post-trough model as of October 1, 2022.
The current 26-variable model has a diverse set of explanatory variables and is quite robust. Each of the explanatory variables has predictive power individually; when combined, the group of indicators is able to identify early recession warnings from a wide range of diverse market-based, fundamental, technical, and economic sources.
Several of the explanatory variables are market-based. These variables are available in real-time (no lag), which means they respond very quickly to changing market conditions. In addition, they are never revised. This makes the Trader Edge recession model more responsive than many recession models. The current and historical data in this report reflect the current model configuration with all 26 variables.
Diffusion Index
The Trader Edge diffusion index equals the percentage of independent variables indicating a recession. With the latest changes, there are now a total of 26 explanatory variables, each with a unique look-back period and recession threshold. The resulting diffusion index and the trend in the diffusion index are two of the variables used to estimate the probit, logit, and neural network model forecasts.
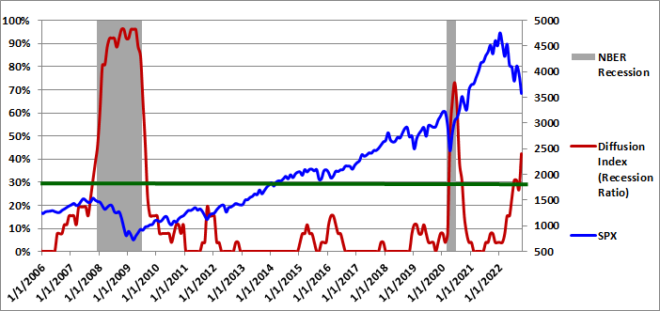
The graph of the diffusion index from 1/1/2006 to 10/1/2022 is presented in Figure 1 below (in red - left axis). The gray shaded regions in Figure 1 below represent U.S. recessions as defined (after the fact) by the National Bureau of Economic Research (NBER).
The number of explanatory variables indicating a recession was 11 out of 26 (42.3%) on October 1, 2022. Historically, values above a 30% warning threshold indicated a high-likelihood of a recession.
The current environment is somewhat unique, perhaps due to COVID-related behavioral changes, the resurgence of inflation, unprecedented fiscal policy and Fed policy intervention, and the war in Europe. Surprisingly, there are a number of pockets of the US economy that are still relatively strong, particularly the labor market. This is creating a challenge for the Fed, and is still propping up consumer spending. Nevertheless, the current diffusion index value of 42.3% is well above the 30% warning threshold.
Please note that past estimates and index values will change whenever the historical data is revised and/or whenever model improvements are implemented. All current and past forecasts and index calculations are based on the most recent models using the latest revised data from the current data set.
0.5-Sigma Diffusion Index
The Trader Edge 0.5-sigma diffusion Index equals the percentage of explanatory variables with Z-scores that are less than 0.5 standard deviations above their respective recession thresholds. This diffusion index is much more sensitive than the standard (zero-sigma) diffusion index. As a result, it provides much more detail on the health of the U.S. economy. The 0.5-sigma diffusion index and the trend in the diffusion index are two of the variables used to estimate the probit, logit, and neural network model forecasts.
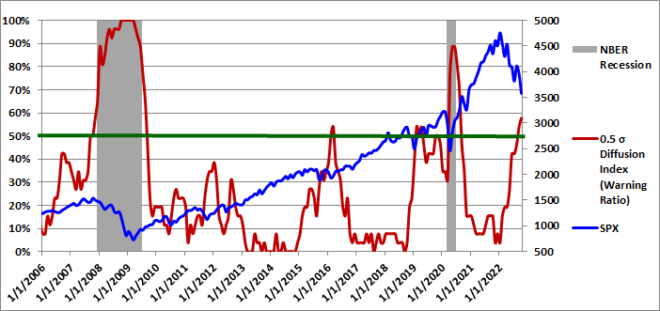
The graph of the 0.5-sigma diffusion index from 1/1/2006 to 10/1/2022 is presented in Figure 2 below (in red - left axis). The gray shaded regions in Figure 2 below represent U.S. recessions as defined (after the fact) by the National Bureau of Economic Research (NBER). The value of the S&P 500 index is also included (in blue - right axis).
The percentage of explanatory variables with Z-scores below the 0.5-sigma early warning threshold was 57.7% as of October 1, easily above the early warning threshold of 50%. The additional level of detail provided by this more continuous and responsive metric is particularly valuable in the months leading up to or emerging from a recession, especially given the infrequent and more discrete movements of the standard (zero-sigma) diffusion index.
This 0.5-sigma diffusion index and the trend in the new diffusion index are both used directly in the neural network recession models. When combined with the recession slack indices, the diffusion index provides even greater insight into rapidly changing conditions.
Recession Slack Indices
The Trader Edge recession slack index equals the median standardized deviation of the current value of the explanatory variables from their respective recession thresholds. The resulting value signifies the amount of slack or cushion relative to the recession threshold, expressed in terms of the number of standard deviations. Higher slack values signify larger cushions above recessionary threshold levels. While the median recession slack index is used in the recession models, I include the mean recession slack index in the graph as well. To mitigate the effect of extreme values (associated with extreme global economic events like COVID), the standardized deviation for each explanatory variable is capped before calculating the mean and median. I use both of these variables in the neural network models and in the probit and logit models.
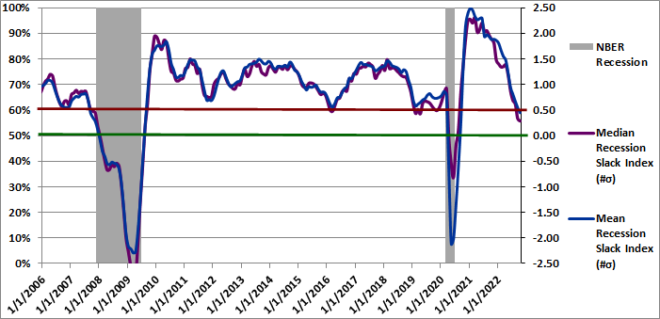
The gray shaded regions in Figure 3 below represent U.S. recessions as defined (after the fact) by the NBER. The median recession slack index is depicted in purple and is plotted against the right axis, which is expressed as the number of standard deviations above the recession threshold. The mean recession slack index is depicted in blue and is also plotted against the right axis.
The dark-red, horizontal line at 0.50 standard deviations denotes a possible warning threshold for the recession slack index. Many of the past recessions began when the recession slack index crossed below 0.50. Similarly, many of the past recessions ended when the recession slack index crossed back above 0.0.
On October 1, 2022, the median recession slack index was +0.29 and the mean recession slack index (affected more by outliers - even when capped) was +0.45. Both slack indices have declined and are continuing to decline rapidly after the initial post COVID rapid growth spurt. They have both dropped below the early warning level of 0.50 sigma.
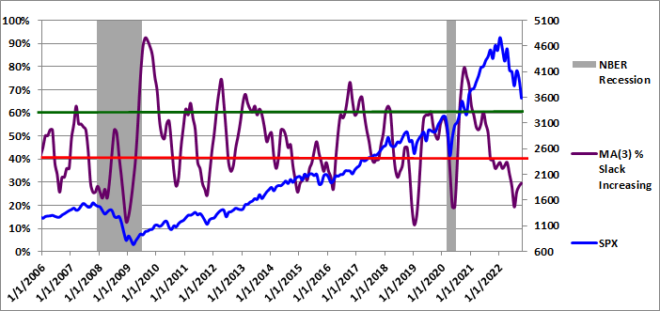
To gain further insight into the slack index, I provide the three-month moving average of the percentage of variables with increasing slack in Figure 4, but I personally monitor the monthly percentages as well.
Slack is a standardized value, so it is directly comparable across all variables. More slack indicates a larger cushion relative to a recessionary environment. As a result, we would like to see as many variables as possible with increasing slack. Given the diverse nature of the explanatory variables, it is unusual to see more than 60% of the variables with increasing slack or fewer than 40% of the variables with increasing slack. These extreme values are significant and usually predictive of the near-term direction of economic growth and often the equity market.
The 3-month moving average of the percentage of variables with increasing slack was only 29.5% on October 1, 2022. The value for the latest single month was even lower: 23.1%, Values below 40% are typically cause for concern and this environment in no exception. The three-month moving average initially fell below 40% on September 1, 2021 has not exceeded 40% since. New evidence of economic weakness (or strength) often shows up first in this timely metric.
The ability to track small variations and trend changes over time illustrates the advantage of monitoring the continuous recession slack index. The new slack variable provides additional insight into the near-term direction of the economy and should be used in conjunction with the median recession slack index.
While it is useful to track the actual recession slack index values and percentage of variables with increasing slack, the diffusion percentages and slack index values are also used to generate the more intuitive probit, logit, and AI probability forecasts.
Aggregate Recession Probability Estimate
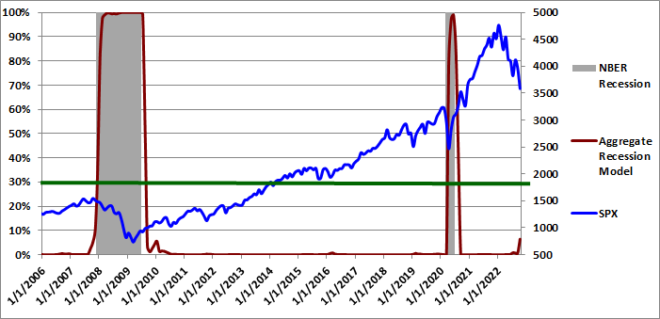
The Trader Edge aggregate recession model averages the estimates from probit and logit models derived from the level and trend in a subset of the four variables described above: the original diffusion index, the 0.5-sigma diffusion index, the slack indices, and the percentage of variables with increasing slack. The aggregate recession model estimates from 1/1/2006 to 10/01/2022 are depicted in Figure 5 below (red line - left vertical axis). The gray shaded regions represent NBER recessions and the blue line reflects the value of the S&P 500 index (right vertical axis). I suggest using a warning threshold of between 20-30% for the aggregate recession model (green horizontal line).
The aggregate recession model probability estimate was only 6.4% on October 1, 2022. This forecast suggests that there is only a 6.4% probability the US is currently in a recession. Given the diffusion index and slack data presented above, this forecast is unusually low, probably due to the strength of the labor market and a few other pockets of the US economy - as discussed above. That said, while we did experience two consecutive quarters of negative real GDP growth, the consensus and Atlanta NOW forecasts for real GDP growth in the third quarter are both positive.
Aggregate Peak-Trough Probability Estimate
The peak-trough model forecasts are different from the recession model and are much more responsive. The peak-trough models estimate the probability of the S&P 500 being between the peak and trough associated with an NBER recession. The S&P 500 typically peaks before recessions begin and bottoms out before recessions end. As a result, it is far more difficult for the peak-trough model to fit this data and the model forecasts have larger errors than the recession model.
The Trader Edge aggregate peak-trough model is a weighted-average of the estimates from a number of different neural network models, all of which use the levels and trends of the diffusion and slack indices described above.
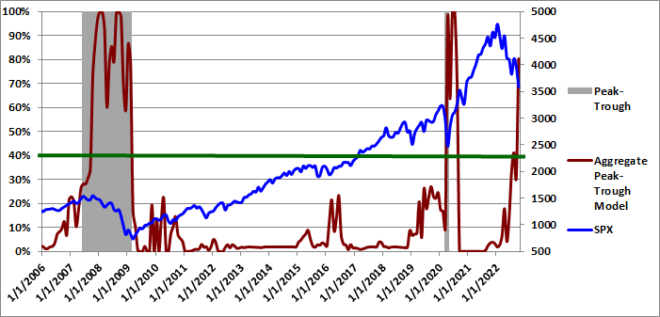
The aggregate peak-trough model estimates from 1/1/2006 to 10/01/2022 are depicted in Figure 6 below, which uses the same format as Figure 5, except that the shaded regions represent the periods between the peaks and troughs associated with NBER recessions. The value of the S&P 500 index is also included (in blue - right axis).
The aggregate peak-trough model probability estimate for 10/01/2022 was 80.3%, almost double the 40% early warning threshold.
AI Post-Trough Probability Estimate
While forecasting recessions is a fascinating endeavor, the principal value of these types of forecasting tools is their ability to provide unique insights into trading and portfolio management decisions - ideally reducing risk and enhancing returns.
The new AI post-trough model was designed for precisely that purpose. After tracking the monthly recession model forecasts for the past year, I became increasingly aware of the growing risk of a recession. Recessions and the associated market declines have historically created very profitable opportunities - when the market and economy eventually recover from the recession. However, being too early can be particularly painful.
As a result, I created the new AI post-trough model that estimates the probability of being in the six-month period immediately following the trough (lowest monthly value) of the SPX - associated with an NBER recession.
The Trader Edge AI post-trough model is a weighted-average of the estimates from a number of different neural network models, all of which use the levels and trends of the diffusion and slack indices described above, in addition to a few other unique variables.
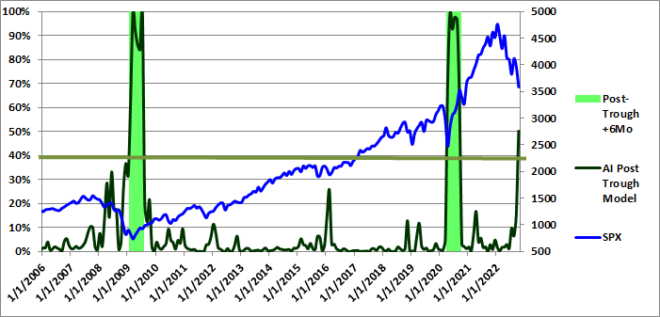
The AI post-trough model estimates from 1/1/2006 to 10/01/2022 are depicted in Figure 7 below, which uses the same format as Figure 6, except that the bright-green shaded regions represent the 6-month periods immediately following the SPX troughs associated with NBER recessions. The value of the S&P 500 index is also included (in blue - right axis).
The AI post-trough model probability estimate for 10/01/2022 was 50.2%, up from 15.5% on 9/1/2022. In other words, the model estimates that there is a 50.2% probability that the SPX has bottomed - associated with a recession subsequently identified by the NBER.
How do we interpret this new forecast? Here is some context. First, note the horizontal, muted green line at 40% in Figure 7 below. Historically, AI post-trough model estimates above 40% indicated the SPX had bottomed. The most recent estimate of 50.2% exceeds this threshold.
However, the AI post-trough forecasts have typically hit 80%-90% (or higher) for several months during most historical six-month post-trough periods. Additional confirming post-trough monthly estimates and/or higher post-trough estimates in subsequent months would provide compelling evidence of a bottom.
Final caveat: it is important to note that forecasting market troughs in real-time is particularly difficult - but having an objective, quantitative post-trough forecast is invaluable.
Note, all of the graphs show the period from 2006-2022, but the model forecasts and data go back for over 60 years.
Conclusion
The October 1, 2022 aggregate recession model forecast (indicating a current US recession) was only 6.4%. However, all of the other model values were substantially more alarming. The two diffusion indices (42.3% and 57.7%), the slack indices (median: 0.29 and MA percent-increasing: 29.5%), and the peak-trough estimate (80.3%) all penetrated their respective early warning thresholds, several by wide margins. Finally, the new AI post-trough model jumped from 15.5% to 50.2% in the last month. The probability a recession-related bottom in the SPX has increased notably, but the interpretation of the latest forecast is not definitive.
I continue to use the monthly Trader Edge recession model results to inform my own trading, hedging, and risk management decisions. However, due to time limitations, I no longer publish the recession forecasts on a monthly basis. However, if time permits and conditions warrant, I may post an occasional recession model update - as was the case this month.
Unlike human prognosticators, the Trader Edge recession models are completely objective and have no ego. They are not burdened by the emotional need to defend past erroneous forecasts and will always consistently apply the insights gained from new data.
Brian Johnson
Copyright 2022 Trading Insights, LLC. All rights reserved.
AI Volatility Edge Platform: E-Subscription
Option Income Strategy (OIS) Universal Filter: E-Subscription


Thanks, Brian! The objective analysis is so refreshing these days.