The TRIN (also called the ARMS index) is a breadth indicator created by Richard W. Arms. It acts as an oscillator and extreme values can be used to identify overbought and oversold conditions. Unfortunately, the standard TRIN indicator has some unusual and undesirable characteristics, which makes it difficult to use in practice. This article introduces a modified version of the TRIN indicator, provides a graphical example, and includes AmiBroker code for the new indicator.
TRIN Indicator Deficiencies
The TRIN is calculated by dividing the advance decline ratio by the advance decline volume ratio, using every issue on an exchange (e.g. NYSE) or in a broad market index (S&P 500).
TRIN = (advances / declines) / (up volume /down volume)
The resulting indicator moves in the opposite direction as the market, which is counter-intuitive. The TRIN decreases on large up days and increases on large down days.
The TRIN indicator is centered on 1.0, but the indicator values are asymmetric. A bearish value of 2.0 corresponds to a bullish reading of 0.5; a bearish reading of 4.0 corresponds to a bullish value of 0.25. A TRIN value of 1.0 is neutral, but bearish deviations from 1.0 are much larger than comparable bullish deviations. Due to the asymmetry, moving averages of the TRIN are biased and therefore unusable.
A Symmetric TRIN Indicator (SymTRIN)
Fortunately, it is relatively easy to both change the directional behavior of the TRIN and make it symmetric. To do this, I created a new version of the TRIN indicator using three conditional formulas:
- If TRIN > 1 (Bearish), SymTRIN = - TRIN + 1.0
- If TRIN < 1 (Bullish), SymTRIN = (1.0 / TRIN) - 1.0
- If TRIN = 1 (Neutral), SymTRIN = 0.0
The new SymTRIN indicator is centered on zero and is continuous, unbiased, and symmetric, which allows us to calculate moving averages of SymTRIN. In addition, it moves with the market, rising in an up move and falling in a down move. A value of 1.0 would mean the bullish volume was 100% greater than the bearish volume. A reading of -2.0 would mean the bearish volume was 200% greater than the bullish volume.
SymTRIN in Practice
Extreme values of SymTRIN could be used to identify overbought and oversold conditions, setting up potential reversal trades. For example, using a threshold of 1.0 or 100%, the market would be overbought when SymTRIN exceeded 1.0 and oversold when SymTRIN fell below -1.0.
However, these reversal trades would require trading against the prevailing trend, which is usually ill-advised. As a result, instead of taking every SymTRIN reversal signal, it might be prudent to use filters to identify higher probability SymTRIN signals, which should reduce risk and improve returns. I have not back-tested these filters, but here are a few possible suggestions.
Bullish Reversal Conditions:
- Daily SymTRIN value below extreme threshold (-1.0)
- Long-term moving average of SymTRIN increasing
- Lagged long-term moving average of SymTRIN below extreme threshold/2 (-0.50)
Bearish Reversal Conditions:
- Daily SymTRIN value above extreme threshold (+1.0)
- Long-term moving average of SymTRIN decreasing
- Lagged long-term moving average of SymTRIN above extreme threshold/3 (+0.33)
The filter conditions attempt to identify situations when the SymTRIN has been extreme for an extended period (#3) but has already begun to reverse (#2) AND the daily value of SymTRIN is also extreme (#1), symbolizing one last unsustainable push by the bulls or the bears before the market reverses. For the actual formulas used in the example below, please see the AmiBroker code at the end of the article.
RUT 2000 Bullish Reversal Example
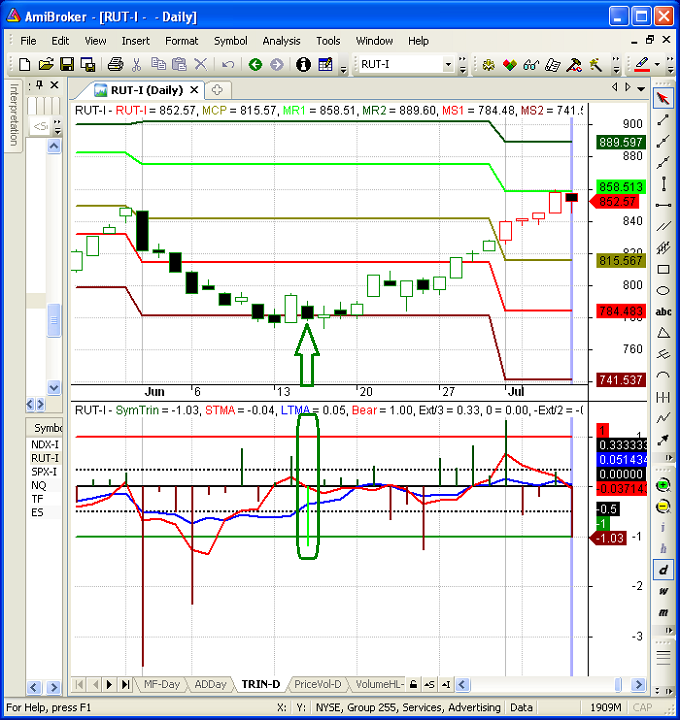
The top panel in Figure 1 below is a daily candlestick chart of the Russell 2000 Index (RUT) in June of 2011. The top panel also contains monthly pivot support and resistance lines. The resistance lines are depicted in green and the support lines are illustrated in red. The monthly central pivot is shown in dark yellow.
The bottom panel contains the daily SymTRIN histogram (based on the NYSE TRIN indicator) with a short-term moving average line (red) and a long-term moving average line (blue). A red horizontal line is used to mark the extreme SymTRIN threshold for bearish reversals. A green horizontal line signifies the extreme SymTRIN threshold for bullish reversals. The dotted lines represent the extreme thresholds for the lagged, long-term moving average.
There are several cases of extreme daily SymTRIN values, but only one instance that met all of the filter criteria, which is noted by the green oval and green bullish reversal arrow below. As you can see from the chart, the lagged long-term moving average (blue line) was below the dashed line, indicating that SymTRIN had been negative or bearish for an extended period. The daily SymTRIN value was also below its extreme threshold, but the long-term SymTRIN moving average was rising, suggesting the bearish move was running out of steam.
On the same day, the RUT index closed below the second or lower monthly pivot resistance line. I did not require this as a formal condition, but it certainly improved the probability of success for this reversal transaction. Monthly pivots, especially MR2 and MS2, frequently act as powerful areas of support and resistance.
As I mentioned earlier, there are several other instances of extreme SymTRIN readings on the chart. In early June of 2011, there was a very bearish daily SymTRIN value (-3.61). However, this occurrence did not meet our filter criteria. Specifically, the long-term moving average (blue line) was still declining and the lagged moving average was not below the extreme moving average threshold (lower black dotted line).
Symmetric TRIN Indicator - AmiBroker Code
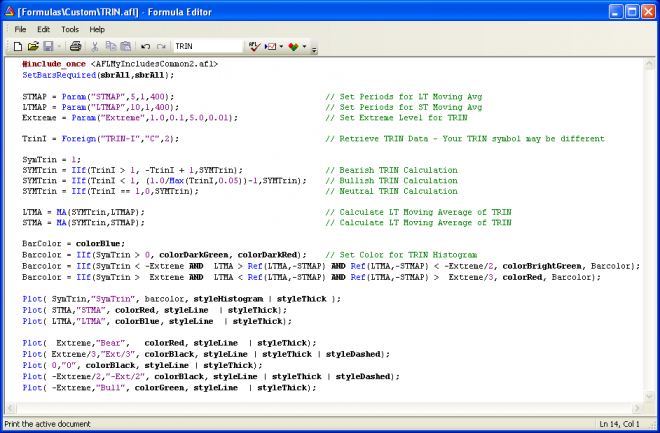
The image below is a screenshot of the SymTRIN indicator from my AmiBroker platform. If you would like to use the indicator, you would need to type the code into AmiBroker and save the formula. The above code compiles and runs without error on my AmiBroker platform. You will need to modify the code to use the TRIN symbol of your choice.
As always, the above post and code sample were provided for educational purposes only and should not be construed as investment advice or used for trading purposes. I have not back-tested the above code and do not make any representations regarding its performance.
Trading Vehicles
For reversal trades, I prefer to use option strategies that have positive income (theta) and have a high probability of profit. For bullish reversals, selling bull put (credit) spreads work well. For bearish reversals, bearish calendar or bearish diagonal spreads can be effective.
These types of contra-trend reversal signals are short-term in nature and often lead to brief periods of consolidation, instead of actual reversals. That is the primary reason that I prefer to use option strategies instead of trading the underlying index or ETF. Properly constructed directional option strategies will be profitable even if the market remains unchanged or moves slightly against you.
Conclusion
The SymTRIN indicator eliminates several of the deficiencies of the standard TRIN indicator. However, when using the SymTRIN indicator, it would still be prudent to use filters to capitalize on the highest probability reversal signals. The SymTRIN indicator is a promising tool and could be useful as one component of a systematic or discretionary trading strategy.
Feedback
Your comments, feedback, and questions are always welcome and appreciated. Please use the comment section at the bottom of this page or send me an email.
Do you have any questions about the material? What topics would you like to see in the future?
Referrals
If you found the information on www.TraderEdge.Net helpful, please pass along the link to your friends and colleagues or share the link with your social or professional networks.
The "Share / Save" button below contains links to all major social and professional networks. If you do not see your network listed, use the down-arrow to access the entire list of networking sites.
Thank you for your support.


i had copied the code but #include_once require.
Manoj,
Sorry for the confusion. I use the include statement in all of my code to access my custom functions, but it is not required for for this indicator. This indicator does not make any function calls and compiles and runs on on my AMIBroker platform without errors (after deleting the include statement).
However, you will need access to the TRIN data and your TRIN symbol may be different.
Best regards,
Brian Johnson
i copied the code but not getting the LTMA and STMA lines
afl has drawn only table format
pls help me out
Kirthi,
Unfortunately, WordPress corrupts actual code when pasted into articles, so code screenshots are the only way I have found to include code in posts. The code in the article works in my version of Amibroker, so if you check your code for typographical errors, it should work.
I have never seen Amibroker chart code generate output in table format, so I cannot offer any suggestions. After I write the code, I simply double click on name of the indicator (TRIN) in the chart tab and Amibroker automatically plots the Trin indicator in a new pane of the active chart template. You obviously need to have the TRIN index in your database, or Amibroker would not be able to find the data.
Sorry I could not be of more assistance.
Regards,
Brian Johnson
Pingback: The Ahrens Moving Average (AMA) | Trader Edge