I introduced the topic of recession forecasting in late October with a discussion of Capital Spectator's Economic Trend index, which I used as a foundation for two new recession forecasting models. Last week I explained the potential limitations of forecasting models when faced with external shocks, including the fiscal cliff.
I have been doing some additional research on recession forecasting and have made several model enhancements and have also created a new neural network peak-trough model. I will discuss these developments in this article, but will not revisit the original research in detail. If you would like a refresher on recession diffusion indices and probit models, please use the links above to review the earlier articles.
Diffusion Index Improvements
As you will recall, the diffusion index represents the percentage of independent variables indicating a recession. My original diffusion index had 15 explanatory variables, each with a unique look-back period and threshold.
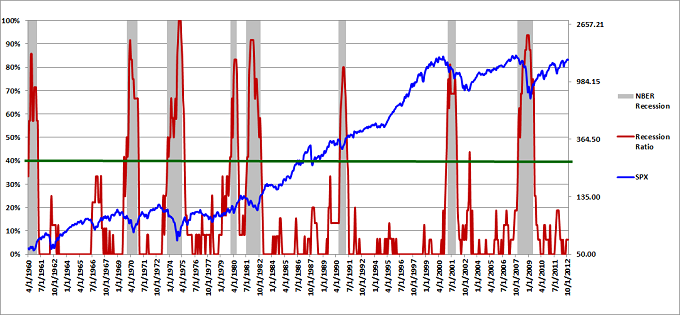
I discovered one new independent variable that has successfully identified recessionary periods in the past. I added the new variable to the original recession diffusion index, bringing the total number of variables to 16. When using a diffusion index, the incremental effect of adding one new variable is small. However, in this case, the new variable did capture an aspect of the market/economy that was not reflected in the other 15 variables. The new diffusion index is presented in Figure 1 below.
The recession diffusion index values are not particularly intuitive and cannot be used directly to determine the probability of a recession. As a result, I initially used the diffusion index and changes in the diffusion index as independent variables to estimate two probit models: a recession probit model and a peak-trough probit model.
Probit Model Improvements
Given that I added a new variable to the diffusion index, I needed to re-estimate the probit models. I used this opportunity to examine multiple combinations of the diffusion index and changes in the diffusion index (over different look-back periods) to identify the pair of variables that best explained the recession data. I limited the number of diffusion index variables to two, to avoid over-fitting the data.
After deciding on the two optimal diffusion index variables, I estimated the new probit recession model, but I also estimated a new logit recession model. Logit models are very similar to probit models, but use a slightly different distribution.
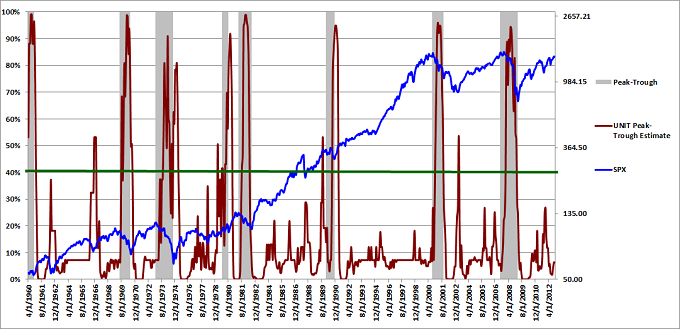
Going forward, I plan to run both models, but calculate the average of the probit and logit model estimates when forecasting the probability of a recession. Averaging the model results leverages the diversity of model predictions to lower the collective model error (per the Diversity Prediction Theorem). I termed the resulting aggregate model the UNIT recession model, because by definition, the dependent variable probability estimates for both underlying models fall between 0.0 and 1.0 (0% and 100%).
The new UNIT recession model estimates are depicted in Figure 2 below (red line - left vertical axis). The gray shaded regions represent NBER recessions and the blue line represents the log value of the S&P 500 index (right vertical axis).
I used the same process to estimate new probit and logit peak-trough models based on the new recession diffusion index values. Again, I first identified the best pair of diffusion index variables and then calculated the optimal probit and logit model coefficients. I calculated the average of the probit and logit peak-trough forecasts to determine the UNIT peak-trough estimates: the probabilities of the S&P 500 being between the peak and trough associated with an NBER recession. The new UNIT peak-trough model forecasts are illustrated in Figure 3 below.
New Neural Network Peak-Trough Model
As I mentioned in an earlier article, I have worked with Neural Network models in the past and wanted to explore using neural network models to forecast the peak-trough probabilities, which are much more difficult to predict than the NBER recession periods. Unfortunately, my previous neural network platform does not work with the Windows 7 operating system. After researching several neural network software alternatives, I decided to purchase NeuroSolutions, including the NeuroSolutions for Excel add-on module.
I am not fully proficient with the software at this stage, but I was able to use NeuroSolutions for Excel to construct five different neural network models, each designed to forecast the peak-trough probabilities. All five models have unique architectures and use different combinations of diffusion index explanatory variables.
Neural networks are extremely powerful and great care must be used to avoid over-fitting the data. As a result, before constructing the models, I divided the data into three separate groups: training, cross-validation, and testing. The training data was used to train the neural network models. The cross-validation data was used (in conjunction with the training data) to identify the best variable combinations and the optimal number of processing elements. Finally, the testing data was used to ensure generalized solutions that were applicable to data outside the training data-set.
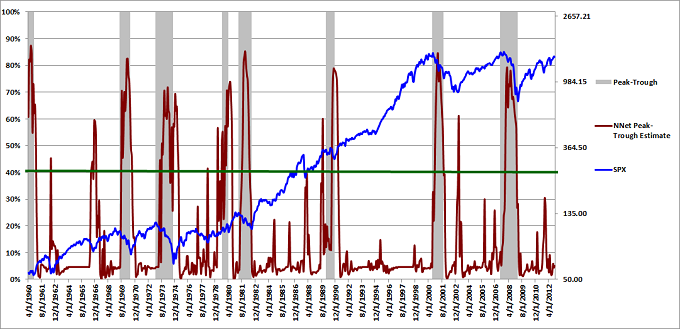
As was the case with the probit and logit recession and peak-trough models, I capitalized on the diversity in model predictions by calculating the average forecast for all five neural network peak-trough models. The resulting neural network peak-trough estimates are presented in Figure 4 below.
The S&P 500 prices lead the NBER recession periods, making it very difficult to precisely identify the market peaks and troughs in a timely fashion. Nevertheless, the UNIT and neural network peak-trough models both provide advance warning of impending recessions and recoveries. Using a threshold of 30% to 40% would help eliminate false peak-trough signals.
It is interesting to note that both the probit and neural network peak-trough forecasts exceeded 50% in 1966, which was not between a market peak and trough during an NBER defined recession, but it was a period when the market suffered a significant correction. Even when the models are "wrong," they can still add value.
Conclusion
Before I continue, I wanted to repeat several important caveats that I stressed in the previous articles:
"Forecasting models in general cannot deal with external shocks that are not directly captured by the data. This includes terrorist attacks, conflict in the Middle East, political disruptions, exits from the Euro, country defaults, etc."
“Given the precarious state of the global economy, if a U.S. recession were to occur, it could come on quickly and it could be severe. Failure to resolve the fiscal cliff would only accelerate that process, making it even more challenging for the models."
The latest forecast for the UNIT recession model was still less than 1%. The UNIT peak-trough forecast was 6.4% and the neural network peak-trough forecast was 5.1%. Please note that all forecasts only include data and data revisions through the first week of November. Several economic releases during November have been weaker than expected, which could cause the model forecasts to rise.
Going forward, I will closely monitor the forecasts of the new UNIT models and the neural network peak-trough model. I also plan to continue to track the CS-ETI. Having continual U.S. recession and peak-trough probability estimates should enhance returns and reduce risk across all strategies and all markets, but these tools should not be used isolation.
Feedback
Your comments, feedback, and questions are always welcome and appreciated. Please use the comment section at the bottom of this page or send me an email.
Do you have any questions about the material? What topics would you like to see in the future?
Referrals
If you found the information on www.TraderEdge.Net helpful, please pass along the link to your friends and colleagues or share the link with your social or professional networks.
The "Share / Save" button below contains links to all major social and professional networks. If you do not see your network listed, use the down-arrow to access the entire list of networking sites.
Thank you for your support.
Brian Johnson
Copyright 2012 - Trading Insights, LLC - All Rights Reserved.


Brian,
What would you recommend as the best way to learn how to build these probit, logit, and neural network models? I have seen various write-ups on each topic online, but I didn’t know if you had a source you liked. Also, is there an Excel add-in that makes this analysis slightly easier?
Thanks!
John,
I found a free Excel Add-in for estimating probit and logit models on a University Website. The software was created for use by students in an introductory econometrics course. The add-in uses Excel’s built-in solver optimization capability to estimate the probit and logit model coefficients. It is not a commercial product, so it has limited capabilities, but it has been sufficient for my purposes.
Probit and Logit models are actually relatively simple. After you install and run a model estimation on a data set, the software will give you the option of generating “predicted probability tables and graphs.” The resulting probability tables and graphs will allow you to examine and experiment with the actual probit and logit functions (formulas). This will help you understand how these models work and how changes in each variable affect the resulting probability estimates.
Neural Networks are much more complicated. As I mentioned, I purchased Neurosolutions software and their Excel Add-in. I provided a link to Neurosolutions in the above article. If you are looking for a more inexpensive solution, I believe that the Neurosolutions for Excel add-in ($295 list price) will work on a stand-alone basis (without the main Neurosolutions software), but with limited functionality.
Neurosolutions also offers an interactive E-Book on Neural and Adaptive Systems ($95). I was already familiar with Neural Networks, so I did not purchase the book and cannot comment on the content. However, based on the table of contents, it appears to be quite extensive.
I would recommend purchasing an introductory book from the same software vendor you decide to use. The book will probably contain actual examples using their software, which would help you learn more about neural networks and help get you up to speed on their software at the same time.
Based on a recent visit to their website, Neurosolutions appears to be offering a 50% Black Friday discount on several of their software products. I believe they also offer a 30-day money back guarantee.
I hope this helps. Good luck with your research.
Best regards,
Brian Johnson