This article presents the Trader Edge aggregate neural network model forecast for the April 2013 non-farm payroll data, which will be released tomorrow morning.
Non-Farm Payroll (NFP) Model Forecast - April 2013
The table in Figure 1 below includes the monthly non-farm payroll data for two months: March and April 2013. The March data was released last month and the non-farm payroll data for April 2013 will be released tomorrow morning at 8:30 AM EDT.
The model forecasts are in the third data row of the table (in black). Note that past and current forecasts reflect the latest values of the independent variables, which means that forecasts will change when revisions are made to the historical economic data.
The monthly standard error of the model is approximately 78,900 jobs. The first and last data rows of the table report the forecast plus 0.5 standard errors (in green) and the forecast minus 0.5 standard errors (in red), respectively. All values are rounded to the nearest thousand. Assuming the model errors are normally distributed, roughly 31% of the observations would fall below -0.5 standard errors and another 31% of the observations would exceed +0.5 standard errors.
The actual non-farm payroll release for March 2013 is in the second data row of the table (in purple). The consensus estimate (reported by Briefing.com) for April 2013 is also in the second data row of the table (in purple). The reported and consensus NFP values also include the deviation from the forecast NFP (as a multiple of the standard error of the estimate). Finally, the last column of the table includes the estimated changes from March to April 2013.
Model Commentary
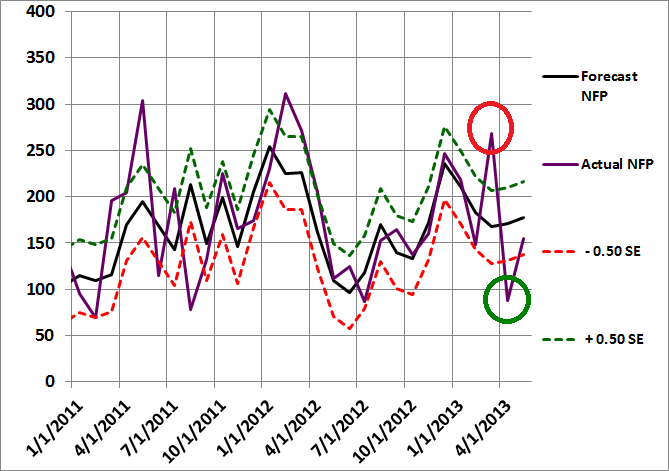
The model forecast for April is 177,000, which is almost unchanged from last month's revised forecast of 171,000. The Briefing.com consensus estimate for April is 155,000, which is 0.28 standard errors below the model forecast. The actual NFP observation in March was significantly lower than the revised model forecast (-1.05 S.E.). However, the artificially low NFP value in March was probably due to the artificially high NFP value in February (+1.27 S.E.). The two circled observations in Figure 2 below represent the actual February (overstated) and March (understated) NFP data. The sampling methodology for the NFP report is notoriously inaccurate and large positive errors are frequently offset by large negative errors in subsequent months.
According to the aggregate NFP model, there has been very little change in the employment environment over the past three months, which probably paints a more accurate picture of the employment situation than the wild swings in the reported NFP data. Nevertheless, both the model forecasts and the actual NFP data indicate that the job growth has slowed since late 2012.
Summary
Basic forecasting tools can help you identify unusual consensus economic estimates, which often lead to substantial surprises and market movements. Identifying such environments may help you protect your portfolio from these corrections and help you determine the optimal entry and exit points for your strategies.
Feedback
Your comments, feedback, and questions are always welcome and appreciated. Please use the comment section at the bottom of this page or send me an email.
Referrals
If you found the information on www.TraderEdge.Net helpful, please pass along the link to your friends and colleagues or share the link with your social or professional networks.
The "Share / Save" button below contains links to all major social and professional networks. If you do not see your network listed, use the down-arrow to access the entire list of networking sites.
Thank you for your support.
Brian Johnson
Copyright 2013 - Trading Insights, LLC - All Rights Reserved.


Hi Brian
Thank you once again for your excellent research. I always learn so much from your articles.
I was struck today as I looked at your model how it reminded me of one those used to show predictions of sunspots (NASA).
The research articles are quite interesting as to the different mathematical approaches used and their relative success, however the math is way over my head!
Perhaps it is of some interest to you…
Kind regards
John
http://solarscience.msfc.nasa.gov/predict.shtml
JD,
Thanks for your comments. I worked with neural networks several years ago and using neural networks to forecast economic variables and recessions were a logical extension of my earlier research.
I was not familiar with models used to forecast sunspot behavior, but I am not surprised that NASA is working on it. Based on a quick review of the link you provided, it appears that the sunspot research is based on cycles, which is obviously a popular research topic in economic and market forecasting as well. It would be interesting to investigate this further and see if there are any tools that could be applied to trading.
Thanks again for your interest in Trader Edge.
Best regards,
Brian Johnson