
I read about this indicator in an article titled "Build A Better Moving Average," which appeared in the October 2013 issue of Technical Analysis of Stocks and Commodities. The article was written by Richard D. Ahrens. In the article, Ahrens introduced an interesting new moving average of his own design called (coincidentally) the Ahrens Moving Average (AMA). The following article briefly summarizes the advantages of the AMA and provides sample AMIBroker code, which will allow you to experiment with the AMA in charts and in your strategies.
Smoothing the Data
The moving average is one of the oldest and most popular trend identification tools in technical analysis, yet all moving averages are influenced by fluctuations in the data, which can obscure the trend. As a result, we would prefer to have a smoother moving average - one that is less susceptible to noise in the underlying price data.
There are two ways to create a smoother moving average. First, we could smooth the price data before calculating the moving average. This technique could be applied to any moving average calculation. Ahrens proposes several techniques for smoothing the price data, but I will focus on just one in this article: the central pivot. The central pivot price is the average of the high price, low price, and closing price for a specified period.
The central pivot can also be used as the foundation for calculating daily, weekly, or monthly support (S1, S2) and resistance (R1, R2) levels for any price series. This is a powerful tool and I may devote a future article to pivot support and resistance levels. If you are interested in an example of how monthly pivot levels can be used in practice, I would encourage you to revisit "Symmetric TRIN Indicator Identifies Potential Reversals."
Most technicians calculate moving averages on the closing price, but this does nothing to reduce noise in the data. Ahrens provides detailed evidence about the advantages of various smoothing techniques in this article, which I would encourage you to read in detail. There are other techniques that offer additional smoothing over the central pivot, but the central pivot is more representative of the data.
Ahrens Moving Average (AMA)
Now that we have decided on a data series, the algorithm for calculating the moving average itself can also provide additional smoothing benefits. Below is a screenshot of the AMIBroker code for the Ahrens Moving Average (AMA). I use a screenshot to display the code (Figure 1 below), because my blog platform corrupts the code when copied and pasted. As a result, you would need to type the code manually into AMIBroker if you would like to experiment with the AMA.
The AMIBroker code calculates the AMA of the central pivot price for your choice of periods. If you would like to use the AMA in other strategies or indicators, I suggest you use the AMIBroker code sample to create an AMA function that could be called directly.
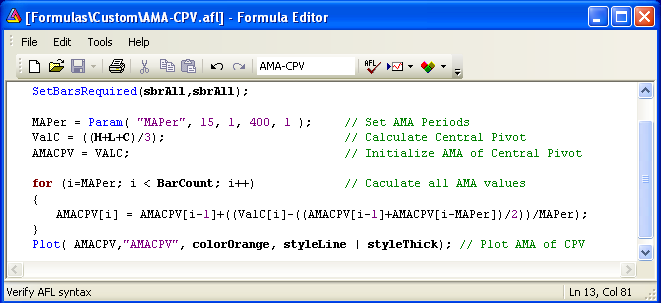
Figure 1: Ahrens Moving Average (AMA) AMIBroker Code
A Visual Example
When a moving average manipulates the underlying price data, this imposes a delay, which causes the moving average to lag the price data. Different levels of smoothing create different delays. Figure 2 below is a daily candlestick chart of the S&P 500 index from May 2013 to October 2013. The blue dashed line is a 15-day simple moving average. The solid purple line is a 22-day exponential moving average. The solid orange line is an 11-day AMA.
I varied the periods to coordinate the delays in the three moving averages. Note how the peaks and troughs in each moving average are consistent for all three moving averages. In other words, all of the moving averages reach their respective peaks and troughs at approximately the same time.
The AMA tracks the data more closely than the other two moving averages and it is significantly smoother as well. This makes it more useful in identifying the underlying trend in the price data.
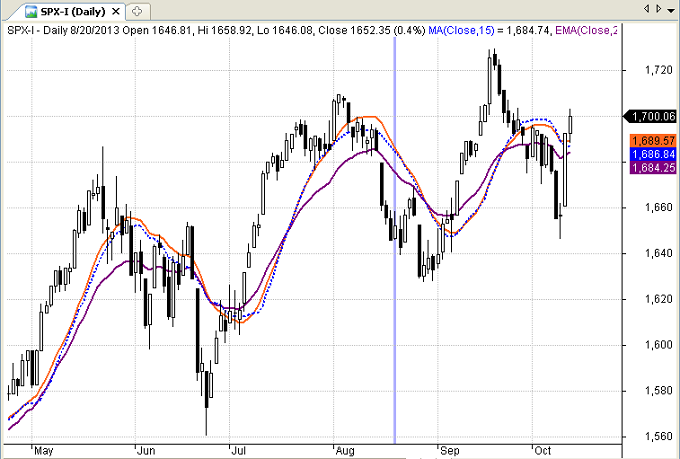
Figure 2: Ahrens Moving Average on S&P 500 Index
Conclusion
Ahrens was kind enough to share the results of his moving average research in his article. Trading magazines and blogs are excellent sources of new ideas for indicators and strategies. The AMA looks promising and I encourage you to read the Ahrens article in the October 2013 issue of Technical Analysis of Stocks and Commodities. I hope you find the sample AMA code useful in your trading.
Trader Edge Strategy E-Subscription Now Available: 20% ROR
The Trader Edge Asset Allocation Rotational (AAR) Strategy is a conservative, long-only, asset allocation strategy that rotates monthly among five large asset classes. The AAR strategy has generated 20%+ annual returns over the combined back and forward test period. Please use the above link to learn more about the AAR strategy.
Feedback
Your comments, feedback, and questions are always welcome and appreciated. Please use the comment section at the bottom of this page or send me an email.
Referrals
If you found the information on www.TraderEdge.Net helpful, please pass along the link to your friends and colleagues or share the link with your social or professional networks.
The "Share / Save" button below contains links to all major social and professional networks. If you do not see your network listed, use the down-arrow to access the entire list of networking sites.
Thank you for your support.
Brian Johnson


Thank you for your coverage of the Ahrens Moving Average. You
mention that “the central pivot is more representative of the data.”
Does the central pivot provide advantages beyond noise reduction?
Since the Open-Close Average I use as an input filter for the AMA
is smoother than the central pivot, I have to assume there is some
other reason to use the central pivot in place of the OCA. . .
Richard,
Thank you for your comment. While the Open-Close average is smother than the central pivot, it contains less information. I use moving averages as an indication of the strength and direction of the trend. Smoothness is a desirable trait, but I also want the data to be representative of the trend.
The open price is widely considered to have the least value among the OHLC data. As the opening price of the day, it is driven primarily by the behavior of the foreign markets overnight and by pre-market order flow, which often leads to unrepresentative price moves that are frequently reversed during the normal trading session. This is the reason that many day-traders have developed successful strategies to fade the opening gap.
Conversely, the High, Low, and Closing prices all benefit from all traders acting on new technical, fundamental, political, economic, and market related information received throughout the day and fully incorporates the effects of fear and greed (low and high) on the market prices. In addition, in a trending market, the average of the HLC data will typically track the market more closely than the OC average – almost like reducing the lag.
Finally, the central pivot data (and R1, R2, S1, and S2) have been used for decades – all the way back to the early floor traders. I have used the central pivot and the accompanying support and resistance levels in several of my strategies, so I often choose the central pivot as a starting point for moving averages.
I enjoyed your article. Thanks again for sharing your research and for following up on Trader Edge.
Best regards,
Brian Johnson
Your arguments in favor of the central pivot are
appealing but specious. More data does not necessarily
yield more accuracy. The high and low of the day are
outliers and are measurably more noisy than the open
and the close. Adding noise does not produce a better
signal. It can be easily shown that the open and the
close both track the trend better than either the high
or the low.
The objective of averaging is to eliminate noise and
uncover the trend. Removing the high and low from
the equation reduces noise and produces a value which
is more representative of the actual trend.
Asserting that something is widely used and has been
for a long time is a common refuge of those who want
to hang onto the old and familiar rather than moving
forward. I’m not an iconoclast. I don’t attack tried and
true methods on a whim. But when I discover something
that works better, then I incorporate it into my set
of tools. (O + C) / 2 works the best so I use it.
Richard,
Thanks again for sharing your comments on Trader Edge. As I mentioned earlier, I agree that smoothness is a desirable trait for a moving average and I have no reason to question your conclusion that the average of the open and close is smoother then the central pivot. However, smoothness is not the only objective.
You state that the high and low are outliers. I believe the high and low are invaluable indications of the relative strength of buyers and sellers and including the high and low results in a more representative moving average. Removing the high and low may reduce noise, but it does so at the expense of accurately representing the data. These are competing objectives.
The following images are monthly candlestick charts of the S&P 500 index during the 2000 and 2008 recessions. The red line is a seven period AMA based on the average of the open and close. The blue line is also a seven period AMA, but it is based on the central pivot (average of the high, low, and close).
Notice that the AMA of the central pivot tracks the data more closely and more accurately reflects the severity of the downtrend. The AMA using the open and close lags the AMA of the central pivot. This will typically be the case during strong up-trends and down-trends. The relationship of the high and low contains directional information.
I find the AMA to be a useful tool, which is why I wrote the original article. The purpose of this site is to share information and insights that will help other traders; divergent opinions definitely furthers this goal. We obviously disagree about several key issues, but that’s what makes markets.
Thanks again for sharing your insights and I look forward to your next article.
Best regards,
Brian Johnson
You are right. The charts clearly show that
the HLC preprocessing filter produces less
phase lag than the OC filter, and phase lag is
an important element of a moving average’s
utility.
If the HLC filter does not cause any
significant reduction in the smoothness of
the final average, I will change my code
to use it instead of the OCA.
regards,
richard
Richard,
In strong uptrends, the market will frequently close near the high. Conversely, in powerful downtrends, the market will often close near the low. This helps the central pivot calculation (HLC average) respond faster to price movements than the OC average. In directionless markets, the relationship of the close relative to the high and low will be more random.
The HLC should provide some noise reduction benefits, but due to the inclusion of the high and low for the period, the central pivot AMA will probably not be as smooth as the OC AMA.
Someday it would be interesting to calculate daily volume-weighted-average-prices (VWAPs) based on 5-minute intra-day data and use those daily VWAP values to calculate the AMA. The noise reduction should be significant and it would be hard to find a more representative single daily price for the AMA calculation. The only problem would be getting access to sufficient historical intra-day data for the VWAP calculation.
Thanks again for taking the time to share your research and your comments.
Best regards,
Brian Johnson