
For the first time, I have decided to offer an e-subscription to the signals from one of my favorite proprietary strategies. I initially developed this strategy after the 2008 crash for use in my IRA account and have made several minor enhancements over the past few years. The simulated, compound-annual return from 1/1/1990 to 7/29/2013 was 20.23% (after estimated transaction costs).
The historical results presented throughout this article include the backtest and forward test periods. The monthly subscription cost is $50 for non-professionals (individual investors) and $1,000 for professionals (banks, hedge funds, insurance companies, registered investment advisers, CTAs, mutual funds, endowments, pension plans, etc.). The annual subscription cost is $499 for non-professionals and $9,990 for professionals. All fees are paid in advance via PayPal.
I selected this strategy for an e-subscription because it is easy to understand and to execute. It is a conservative, long-only, asset allocation strategy that rotates monthly among five large asset classes: large-cap U.S. stocks, developed country stocks in Europe and Asia, emerging market stocks, U.S. Treasury Notes, and commodities. Stop-loss orders are used on every trade to control losses and facilitate position sizing. This article describes the mechanics of the Asset Allocation Rotational (AAR) strategy and explains how to place your order using the PayPal buttons at the end of this article. Even if you are not interested in a subscription, you should find some of the insights helpful as you research and develop your own trading strategies.
How the AAR Strategy Works
The mechanics of the AAR approach is very straightforward. At the end of every month, a single proprietary formula is used to calculate a score or ranking for each of the securities representing the five asset classes; high scores are good and low scores are bad. After calculating the initial scores, filters are applied to each security. If a security fails to pass one or more of the filters, its score would be set to zero. The strategy then purchases the security with the highest positive score. Finally, a stop-loss order is entered 7.75% below the purchase price. If none of the securities has a positive score at the end of the month, the strategy sells the existing position (if any) and remains in cash for the subsequent month. The process is repeated at the end of every month. It's that simple.
Most rotational strategies are based on momentum or relative strength. As a result, they purchase securities that are moving up in price more rapidly than other securities. Unfortunately, it is possible to have too much of a good thing. Securities that move up in price too far and too fast are more likely to suffer sharp pullbacks and drawdowns.
The AAR algorithm is more sophisticated; it rewards momentum, but penalizes "irrational exuberance." This algorithm helps the AAR strategy identify securities in the "sweet spot" - trending higher, but not overbought. In addition, the momentum scores are all risk adjusted. Finally, the AAR system incorporates proprietary breadth, market sentiment, and COT indicators to eliminate low probability trades with poor risk/reward ratios.
The easiest way to understand the AAR ranking system is to look at a graphical example. The top panel in Figure 1 below is a monthly candlestick chart of the iShares MSCI Emerging Markets Index fund (EEM), which is one of the five assets used by the AAR strategy. I will discuss the choice of investment candidates in more detail later in this article. The histogram in the bottom panel of Figure 1 depicts the month-end AAR rankings for EEM from late 2006 through 2009. The boxes represent AAR trades in EEM: green for profits, red for losses.

Figure 1: AAR Strategy 2013 - EEM Score Example
The following observations should help you better understand the AAR ranking system. First, notice that in late 2007 the AAR strategy exited the EEM position (the ranking went to zero), even while EEM was still rising. The reason? The price rise of EEM was excessive; it was overbought and due for a pullback. After the price of EEM declined the following month, it was no longer overbought and the EEM ranking returned to positive territory.
You will also notice that not all of the blue histogram AAR rankings are outlined with boxes. In these cases, the EEM rankings were positive, but one of the other four investment candidates had a higher positive ranking. Remember, the AAR strategy always invests in the security with the highest positive AAR score.
Finally, EEM had no positive AAR scores in 2008. The AAR strategy only invests in securities that are trending higher. EEM violated this condition during most of 2008, as did most of the other equity alternatives.
The Results
The historical results in this article reflect the simulated performance of the AAR strategy from 1/1/1990 to 7/29/2013, which includes the backtest and forward test periods. The returns were based on month-end closing prices provided by Commodity Systems Inc (CSI), one of the leading providers of market data. Round-trip transaction costs of 0.10% were deducted from every trade. All returns, strategy statistics, and performance graphs were generated by the AMIBroker research platform.
Historical returns are not necessarily indicative of future performance and no simulated trading record can completely account for the impact of financial risk in actual trading. Please review the Disclaimer & Terms before continuing.
Figure 2 below includes all of the strategy performance metrics calculated by the AMIBroker software platform. There are a wide range of statistics that capture every aspect of the strategies' historical performance. Several of the most important statistics are highlighted in green boxes.
The simulated, compound-annual return from 1/1/1990 to 7/29/2013 was 20.23% (after estimated round-trip transaction costs of 0.10% per trade). The strategy was only invested 79.19% of the time (the Exposure). The balance of the time, the strategy was invested in cash (with an assumed rate of return of zero). There were far more winners than losers (70.43% versus 29.57%) and the average winning trade was significantly larger than the average losing trade (6.74% versus -2.17%). Finally, the maximum peak-trough drawdown was -9.39%.
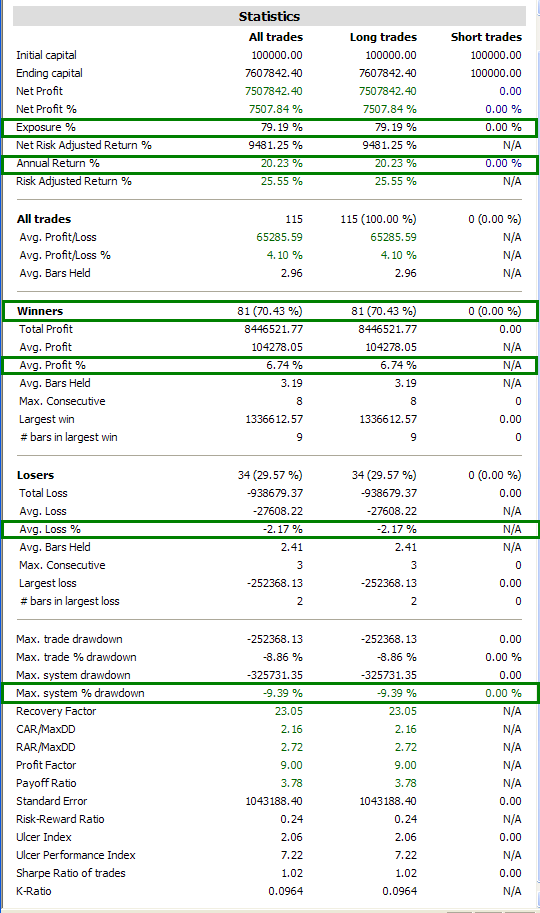
Figure 2: AAR Strategy 2013 - Summary Statistics
A more detailed breakdown of the profit distribution can be found in Figure 3 below. The use of stop-loss orders on every trade limits losses and results in a positively skewed return distribution.
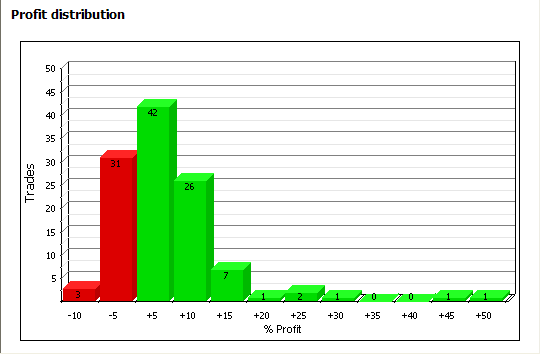
Figure 3: AAR Strategy 2013 - Profit Distribution
The simulated strategy drawdowns are depicted in Figure 4 below. The graph illustrates drawdowns from the previous peak equity value, not losses. For example, a single trade that was up 20% at its peak, but was sold at a later date for a 10% gain would reflect a 10% drawdown, even though it would have been a profitable trade. The high percentage of winning trades and the conservative loss controls helped prevent large drawdowns.
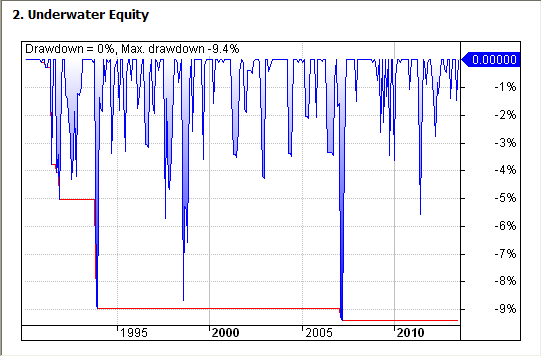
Figure 4: AAR Strategy 2013 - Drawdown Curve
As you would expect, a strategy with a compound annual return of over 20% has a very impressive equity curve (Figure 5 below). The exponential increase in the second half of the period is due to the effects of compounding.
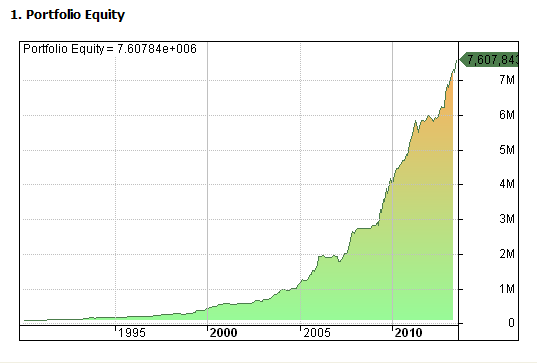
Figure 6: AAR Strategy 2013 - Equity Curve
To gain some perspective on the historical performance of the AAR strategy, it is useful to examine the results for an equal-weighted buy and hold strategy (20% invested in each of the five securities). The compound annual return of the equal-weighted buy and hold strategy would have been 6.15% and the maximum equity drawdown would have been an astounding -48%. With quarterly rebalancing, the compound annual return of the equal-weighted buy and hold strategy would still have been 6.15% and the maximum equity drawdown would have been -43%. The AAR strategy earned an annual return of 20.23% with a maximum drawdown of only -9.39%.
As mentioned repeatedly above, the AAR strategy results reported in this article are simulated and include backtest and forward test periods. As a result, the realized returns of the AAR strategy going forward will be lower and the future realized equity drawdowns will be higher. However, even if we halved the historical returns and doubled the drawdowns, the AAR strategy would still have significantly outperformed the buy and hold strategy with far less risk. Over a typical market cycle, a reasonable objective would be for the AAR strategy to outperform a buy and hold portfolio of the same securities. In addition, over the same cycle, the AAR strategy should experience lower drawdowns than the buy and hold portfolio.
I performed one final test of the AAR strategy. Without altering any of the strategy parameters or decision rules, I tested the above AAR strategy on the database of 20 liquid futures contracts that I use for my proprietary trend-following strategy. The AAR strategy would have earned a compound annual return of over 11% on this alternative asset list. The ability of the AAR strategy to generate attractive returns using a different universe of securities further demonstrates the robustness of the strategy.
For a more comprehensive and detailed view of the historical performance of the AAR strategy, the calendar year returns are provided in Figure 6 on the right side of the page below.
The Investment Candidates
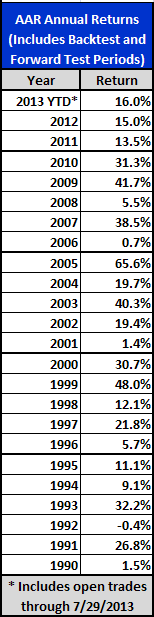
Figure 6: AAR Strategy 2013 - Annual Returns
As mentioned above, the AAR strategy rotates among five large asset classes: large-cap U.S. stocks, developed country stocks in Europe and Asia, emerging market stocks, U.S. Treasury Notes, and commodities. For each asset class, I selected a representative ETF or futures contract to enhance diversification, maximize liquidity, and minimize transaction costs. For those of you who do not trade futures, I will provide specific alternatives that will closely match the performance of the corresponding futures contracts.
The AAR strategy uses the e-mini S&P 500 futures contract (ES) to capture the returns associated with the large-cap U.S. equity sector. The e-mini S&P 500 futures contract is one of the most liquid futures contracts in the world, with an average daily volume of over two million contracts, representing over $100 billion in notional value. The SPDR S&P 500 ETF (SPY) is an excellent substitute for the ES contract. It is also highly liquid with an average daily trading volume of over 130 million shares, representing another $22 billion in market value traded daily.
The AAR strategy uses the iShares MSCI EAFE Index Fund (EFA) to gain exposure to developed country stocks in Europe and Asia. The EFA fund has over $42 billion in assets and an average daily volume of over 18 million shares. Morningstar's description of the EFA fund: "EFA owns large- and mid-cap companies based in developed markets in Europe, Asia, and Australia. This international exposure can help diversify currency, interest-rate, and other local market risks."
As mentioned above, when investing in the emerging markets sector, the AAR strategy uses the iShares MSCI Emerging Markets Index Fund (EEM). The EEM fund has over $35 billion in assets and an average daily volume of over 56 million shares. According to Morningstar, the "IShares MSCI Emerging Markets Index provides market-cap-weighted exposure to emerging-markets equities and is suitable as a core holding. The main argument for investing in international equities is for diversification through exposure to different countries and economies, slightly different sector weightings, and foreign currencies."
The AAR strategy uses the U.S. 10-Year Treasury Note futures contract (ZN) to represent the U.S Treasury Note asset class. The U.S. Treasury Note futures contract is also highly liquid, with an average daily volume of over one million contracts, representing over $130 billion in notional value. For those who do not trade futures, you could substitute any U.S. Treasury note with a maturity date of approximately ten years. Individual Treasury notes are liquid and trade in principal denominations of $1000. The iShares Barclay's 7-10 year Treasury ETF (IEF) would also be a reasonable substitute for the U.S 10-Year Treasury Note futures contract. IEF is liquid, but not nearly as liquid as the other ETFs used by the AAR strategy. IEF has an average volume of approximately 850,000 shares.
The U.S. Treasury Note asset class is very important to this strategy. It represents a safe haven during times of global financial crisis and it is not highly correlated with the other sectors. If you choose to use an alternative investment vehicle as a proxy for this sector, it should contain only intermediate or short-term U.S. Treasury securities. It should never include debt from foreign or corporate issues, which would be more highly correlated with equities.
The final asset class is commodities. The AAR strategy uses the PowerShares DB Commodity Index Fund (DBC) to invest in the commodity sector. The DBC fund has over $6 billion in assets with an average daily trading volume of over 2.2 million shares. According to Morningstar, "PowerShares DB Commodity Index provides exposure to 14 commodities from four sectors: energy, agriculture, industrial metals, and precious metals. Many commodity funds weigh constituents by economic importance, resulting in a heavy energy overweighting, but DBC is well-diversified across commodity sectors, making it a true broad-basket commodity fund. In addition, energy prices are relatively more volatile than other commodity products, so DBC is slightly less volatile than commodity funds with a large energy exposure."
Daily pricing data for the futures contracts above were available through CSI for the entire historical period. While the above ETFs represent the largest, longest-dated funds within their respective asset categories, all had inception dates after 1990. As a result, each fund's corresponding monthly index returns were used to populate the price history for each fund prior to its inception date for testing purposes. In other words, the monthly returns for each fund were assumed to be exactly equal to the monthly returns of its respective index. CSI's proportional back-adjusted pricing methodology was used to ensure fund dividends and quarterly futures rolls were accurately reflected in the historical data.
AAR Strategy E-Subscription & Ordering Information
The monthly subscription cost is $50 for non-professionals (individual investors) and $1,000 for professionals. The annual AAR e-subscription price is $499 for non-professionals and $9,990 for professionals. Subscription fees are payable in advance through PayPal and your subscription will automatically renew until you cancel your subscription. You may cancel your subscription at any time through your PayPal account, but Trading Insights LLC (the owner and operator of TraderEdge.Net) does not offer refunds of subscription fees.
The AAR strategy will be run at the end of every month using CSI's proportional back-adjusted closing prices. The resulting strategy signals will be posted in a restricted (AAR subscribers only) area on the Trader Edge site and/or sent via email to all AAR subscribers. Signals will typically be available either late in the evening on the last business day of the month or shortly before the open on the first business day of the following month. The exact timing of the update will be dependent on the availability of the CSI end of day pricing files. AAR strategy signals may not be shared electronically, verbally, or in writing with non-subscribers.
The following information will be included in the AAR strategy month-end update: month-end strategy transactions, month-end purchase price, initial stop price, ranking scores for all securities, and the results for the most recent AAR transaction. Below is an example from 12/31/2009. Please note the initial stop price must be adjusted after dividends and futures roll transactions.
The AAR strategy trades for 12/31/2009 are summarized in the first two rows. The strategy sold EEM (the iShares MSCI Emerging Markets Index Fund) at a price of 41.50 and purchased ES (the e-mini S&P 500 futures contract) at a price of 1110.75. The stop loss was placed at 1024.66, 7.75% below the purchase price.
The AAR scores for 12/31/2009 are provided in the next two rows. ES had a score of 4.53 and EFA (the iShares MSCI EAFE Index Fund) had a score of 4.33. All other scores were zero. The AAR strategy always owns the security with the highest positive score, which explains the purchase of ES on 12/31/2009.
Finally, the last two lines report the results for the most recent trade. The AAR strategy initially purchased EEM on 4/30/2009 and sold the position on 12/31/2009. The price change was +47.15% and the profit after estimated transaction costs was +47.03%
| Date | Sell | Sell Price | Buy | Buy Price | Stop Price |
| 12/31/09 | EEM | 41.50 | ES | 1110.75 | 1024.66 |
| Date | DBC Score | EEM Score | EFA Score | ES Score | ZN Score |
| 12/31/09 | 0.00 | 0.00 | 4.33 | 4.53 | 0.0 |
| Symbol | Trade Status | Entry Date | Exit Date | Price Change | Profit or Loss |
| EEM | Closed | 4/30/09 | 12/31/09 | +47.15% | +47.03% |
During the registration process, you will enter your contract information and you will also be required to certify that you have read and that you agree to the Disclaimer & Terms. As a result, it is very important that you read the Disclaimer & Terms before placing your order. After placing your order and arranging for payment through PayPal, you will be redirected back to Trader Edge to complete the registration process. After completing the registration form, please log in to verify you have access to the AAR restricted area of Trader Edge.
The AAR strategy is easy to understand and to execute, but is based on sophisticated proprietary ranking and filter algorithms that identify high probability trades with attractive risk/reward characteristics. Stops are used to limit losses and the AAR strategy always trades with the prevailing trend, which further reduces drawdowns. The strategy uses only highly liquid ETFs and futures contracts to enhance liquidity and minimize transaction costs.
Trading Insights LLC will only accept a limited number of subscribers to ensure sufficient market liquidity for AAR strategy transactions. Please use the appropriate PayPal button below to order your non-professional or professional e-subscription to the Trader Edge AAR Strategy Signals. Please review the payment information carefully before completing the transaction with PayPal.
2017 Note: AAR subscriptions are no longer available -
If you have any questions about the AAR strategy, please contact me via email: BJohnson@TraderEdge.NET.
I look forward to working with you.
Brian Johnson
Copyright 2013 - Trading Insights, LLC - All Rights Reserved.


