
The AAR strategy is a conservative, long-only, asset allocation strategy that rotates monthly among five large asset classes: large-cap U.S. stocks, developed country stocks in Europe and Asia, emerging market stocks, U.S. Treasury Notes, and commodities. It is one of the 20 proprietary strategies that I trade in my account and the only strategy that Trader Edge currently offers on a subscription basis.
The AAR strategy earned a return of 26.11% in 2013, outperforming its equal-weighted index (+6.74%) by a remarkable 19.37% during the year.
Remember that the AAR strategy is not an equity strategy. The AAR strategy is based on the Ivy League portfolio framework and every month it has the option of investing in any one of the five diverse investment candidates described above. If none of the five candidates pass their respective trade filters, the AAR strategy remains in cash for the month. Stop-loss orders are used on every trade to control losses and to facilitate position sizing.
AAR Strategy Returns
Of the five investment candidates, only the e-mini S&P 500 futures contract (ES: +31.50%) and the EAFA index (EFA: +21.44%) earned positive returns in 2013. Commodities (DBC: -7.63%), U.S. Treasury Notes (ZN: -3.83%), and emerging markets (EEM: -3.65%) all earned negative returns for the year.
The returns for the five investment candidates are depicted in green (figure 1 below). The index returns (purple) were calculated using the equal-weighted monthly returns for the five investment candidates, excluding transaction costs. Finally, the AAR strategy return was calculated using the actual strategy signals executed at month-end closing prices, net of estimated transaction costs.
All returns were calculated using prices back-adjusted for dividends and futures roll transactions. All prices and back-adjustments were provided by Commodity Systems, Inc. (CSI), one of the leading providers of market pricing data. AAR strategy subscriptions were first offered to the public in July 2013.
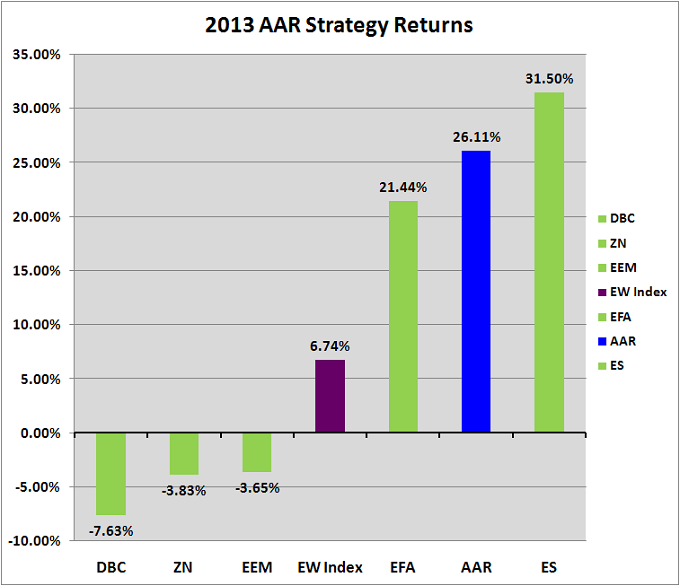
Figure 1: 2013 AAR Strategy Returns
If you are not currently a subscriber and would like to learn more about the AAR strategy, there is a detailed description on the AAR Strategy page.
Brian Johnson
Copyright 2014 - Trading Insights, LLC - All Rights Reserved.


Pingback: 2015 AAR Strategy Results | Trader Edge