Economic releases were mixed in the US last week, but the overall trend is decidedly bearish. The ISM Index value dropped to 49.7, well below the consensus expectation of 52.5 and almost four points below last month's reading of 53.5. ISM Index values below 50.0 signify contractions. This was the lowest reported ISM index value since mid-year 2009.
The ISM Services Index was 52.1, also below both the consensus estimate and last month's reported value. While the services index remained above 50.0, it typically lags the more responsive ISM Index. This makes the ISM release of 49.7 even more foreboding. The recent Philadelphia Fed release of -16.6 is consistent with the weak ISM Index data; the manufacturing sector has slowed dramatically.
The ADP employment report (+179K) provided a glimmer of hope for the private employment environment on Thursday morning. Initial weekly unemployment claims even came in below expectations (374K versus 385K). Unfortunately, Friday morning's non-farm payroll report burst this bubble with a net gain of only 80K jobs, 20K below consensus expectations. Non-farm payrolls have increased by less than 100K for the last three months, well below the 150K-200K new jobs required to accommodate new entrants into the labor force. If it weren't for the increasing number of unemployed Americans that have given up their job search, the unemployment rate would be soaring. The employment trend is negative.
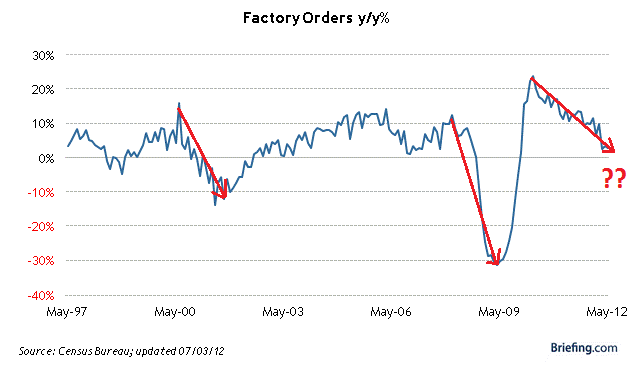
Factory orders were up 0.7%, which was 0.3% above expectations. This appears to be good news, but take a look at the year-over-year trend in factory orders in Figure 1 below (chart from briefing.com). The current environment looks very similar to the beginning of the last two recessions in 2001 and 2008. That is the danger of focusing on the minutia of monthly economic releases and losing sight of the big picture.
Summary Market Indicator Score
My summary market indicator score combines the bullish or bearish readings from 34 separate data series. The indicator score has three main components: technical, breadth and relative strength, and economic indicators that tend to lead the market. All indicators are on a scale of -100 (max bearish) to +100 (max bullish).
Due to the recent rebound in equity prices, the summary indicator score has been rising. As of Friday's close, the overall reading was -0.5. However, all of the recent increase can be attributed to the technical, breadth and relative strength components. The average reading for the leading economic indicators component has now declined to an alarming level of -44.9.
This is a divergence, which I initially mentioned two weeks ago on Trader Edge. Market prices, breadth, and relative strength have been improving, while economic data has been deteriorating. This is an unstable situation, which may have begun to move toward equilibrium on Friday. After the dismal non-farm payroll report, there was a global shift to safer assets.
Market Response
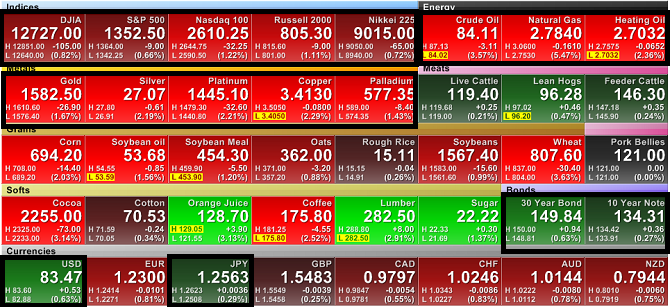
Figure 2 below is the FINVIZ futures heat-map for Friday July 6, 2012. Equities, energy, and metals were all sharply lower, indicating increased risk of a recession and deflation. US Treasury prices, the US dollar, and the Japanese Yen were all higher, also consistent with a risk-off trade.
Europe
The market was initially euphoric after hearing the proposals discussed at the EU summit, but reality has begun to set in. The yield on Spain's 10-year government bond dropped from over 7% before the summit to 6.40% during the week. On Friday, just one week after the summit, the yield spiked over 7% again, before closing at 6.96%. Yields on Italy's 10-year bond fell to almost 5.6% after the summit, but have since climbed back into the danger zone above 6%.
It is important to remember that nothing structurally has changed in Europe. None of the proposed changes have been implemented - or even formally adopted by the member nations. Finland is now requesting additional collateral from Spain before committing to any bailout. Many more roadblocks will probably surface before any formal changes are implemented.
Even if additional loans were made to Spanish banks, the loan losses wouldn't go away. And the new loans would need to be repaid - with interest. When weak, over-leveraged entities take on more debt, it increases default risk. Bond investors then demand higher yields, which reduces cash flow, which further increases default risk. More debt will not solve the problem of too much debt. The bond market is beginning to come to the same conclusion. While these prospective new loans may not initially be senior to outstanding debt, those rules could change retroactively - as they did with Greece (and General Motors for that matter). Bond investors in Europe would be wise to plan accordingly.
What About Monetary Policy?
As already discussed on Trader Edge, the Federal Reserve is continuing Operation Twist through the end of 2012. On Thursday of last week, there was a flurry of central bank activity. The Bank of England announced a new Quantitative Easing (QE) program, China reduced their short-term interest rates, and the European Central Bank (ECB) cut its benchmark lending rate 0.25% to a new-low of 0.75%.
How did the markets respond to these widespread stimulative policy moves? Global equity markets declined. Why? When rates are already at historic lows, marginally lower rates have little effect. Instead, these moves were viewed as impotent acts of desperation, which provided additional evidence of the fragile state of the global economy.
The Federal Reserve meets again at the end of July. Given the continued economic weakness, they could elect to implement another round of Quantitative Easing (QE3). The market would probably move higher on the news - at least initially, but the effects would be short-lived. The level of interest rates is not the problem and monetary policy cannot prevent recessions.
The economy is at a critical tipping point: Europe is in disarray, China is slowing, and we are approaching our own fiscal cliff. The results are not a foregone conclusion, but the bears are growling. Earnings season may tip the scales
Feedback
Your comments, feedback, and questions are always welcome and appreciated. Please use the comment section at the bottom of this page or send me an email.
Do you have any questions about the material? What topics would you like to see in the future?
Referrals
If you found the information on www.TraderEdge.Net helpful, please pass along the link to your friends and colleagues or share the link with your social network.
The "Share / Save" button below contains links to all major social networks. If you do not see your social network listed, use the down-arrow to access the entire list of social networking sites.
Thank you for your support.
Brian Johnson
Copyright 2012 - Trading Insights, LLC - All Rights Reserved.
.


As always, great commentary Brian. Just wondering if, in your opinion, QE3’s impact would be as short-lived across the commodities complex as it would the equities market. In particular, I’m wondering about gold, silver and oil, all of which have been badly trailing US equities on a relative strength basis of late….
Bill,
Thanks for your comments and for a great question. In the long-run, I expect the prices of metals and energy to be determined by the state of the economy. If we get additional monetary stimulus (QE3) and we were able to avoid a recession, that would be quite bullish for commodities, especially the contracts that are more sensitive to the economy like crude oil and copper.
However, if we are headed into a global recession, then it could be severe. It would likely be accompanied by credit events in Europe, which could spread throughout the financial sector. 2008 provides a recent benchmark for the recession scenario: gold down 35%, equities down 55%, silver down 60%, copper down 70%, and crude oil down 80% (all values peak to trough). In this scenario, monetary stimulus (QE3) would not save the commodity sector. Fear of deflation is too powerful. However, commodities have already declined significantly from their recent highs, but equity prices have held up remarkably well – at least so far.
On a short-term basis, metals and crude oil are significantly oversold. More important, my custom COT indicator is bullish for the individual metal and energy contracts and for the metal and energy groups in aggregate. Within the metal group, Gold, Copper, and Platinum have broken above their short-term trendlines. This combination is typically bullish, but all of the metals are still trading below their long-term trendlines – suggesting caution and diligent stop management on any bullish positions. Crude Oil has also broken above its short-term trendline, but the slope of that trendline is quite steep; it is a scary-looking chart.
Thanks for your interest in TraderEdge.Net.
Regards,
Brian Johnson
That’s a very helpful response Brian. Much appreciated!
Pingback: ECRI: "We're in a Recession" | Trader Edge