
Every finance student is taught the benefits of diversification. Some learn the requisite formulas and a few even understand how to apply the formulas in practice. Unfortunately, business schools leave out the most important lesson: the limits and costs of diversification.
Diversification
In theory, the concept of diversification is simple; combining assets with less than perfectly positive correlation reduces the standard deviation of portfolio returns. Correlations are measured between pairs of assets and range from -1.0 (perfectly negatively correlated) to +1.0 (perfectly positively correlated). A correlation of zero means no correlation between the returns of the two assets.
If two assets were perfectly negatively correlated, it would be possible (again, in theory) to create a riskless portfolio of those two assets with a standard deviation of zero. Unfortunately, finding undervalued assets with negative correlations is virtually impossible. In addition, if you have two assets that are perfectly negatively correlated, then the next asset you add to the portfolio could not be negatively correlated with both of the original assets.
The benefits of diversification accrue very quickly as you add assets, but the incremental benefits also diminish rapidly. Figure 1 below is a graph of portfolio standard deviation (y-axis) as a function of the number of assets in the portfolio (x-axis). Each asset has a standard deviation of 20% and every pair of assets has a correlation of 0.70. All portfolios are equally-weighted.
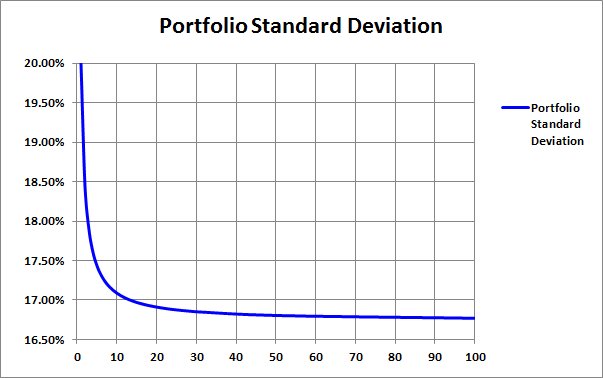
Figure 1: Portfolio Standard Deviation
The standard deviation of a one-asset portfolio would obviously be 20%. Increasing the number of assets from one to five would reduce the portfolio standard deviation from 20% to 17.44%, a decrease of 2.56%. Increasing the number of assets from five to 100 would only reduce the portfolio standard deviation from 17.44% to 16.77%, an incremental reduction of only 0.67%.
Risk Management in Practice
Given a variance-covariance matrix for a specific list of assets, it would be relatively simple to solve for the minimum variance portfolio. Unfortunately, the resulting portfolio standard deviation would significantly understate the actual risk of the portfolio. The academic assumptions of modern portfolio theory are unrealistic and inconsistent with the actual behavior of asset prices.
First, volatility or risk (as measured by standard deviation) is not constant. To make matters worse, volatility is correlated among a wide range of assets. In other words, when volatility increases in one sector, it typically increases in another. This phenomenon is well known among market practitioners, but there is one more problem that is much more subtle: correlations between asset pairs are variable and market dependent. Asset correlations and volatility both move inversely with equity prices.
When you put all of these factors together, it becomes a risk management nightmare. When equity prices drop sharply, not only does volatility increase dramatically, but correlations also increase. This is the worst possible scenario. Asset prices drop more than expected AND diversification fails us when we need it the most.
Conversely, when equity prices rise, volatility and correlations both decline. In other words, asset prices increase less than expected and not all assets participate in the rally.
The chart in Figure 2 below illustrates these effects. The purple lines depict correlation, the green lines represent the price of the S&P 500 index, and the blue/teal lines at the bottom of the graph represent the VIX. I recognize that the text is small and difficult to read, but focus on the relationships between price, correlation, and volatility.
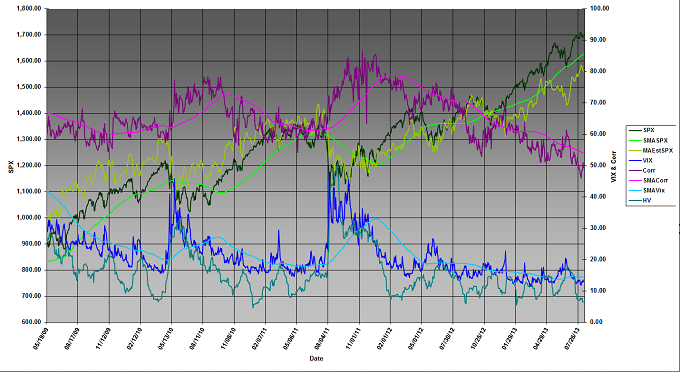
Figure 2: S&P 500 - Price, Correlation, & Volatility
In 2011, equity prices plummeted (green), while volatility spiked (blue) and correlations increased from 60% to 85%. We saw the opposite scenario in 2013. Equity prices rose steadily, while correlations and volatility declined consistently. As a result, modern portfolio theory systematically understates downside risk and overstates upside potential.
Strategy Implications
As illustrated above, diversification can reduce risk, but the first few positions provide the greatest benefit. Due to the fact that correlation and volatility move inversely with equity prices, diversification often fails to effectively reduce risk in a declining market. In addition, diversification is not free - and I am not referring to transaction costs.
One of the best ways to enhance any strategy is to use position scores to rank all trades that satisfy the systematic entry criteria. Hypothetically, if signals were generated simultaneously in 20 different securities, the strategy might only purchase the two or three securities with the highest position scores or rankings.
There are many effective ranking systems including momentum, relative value, sentiment, or some combination. Forcing strategies to focus exclusively on the highest ranked signals can greatly enhance returns and significantly reduce downside risk. If the above hypothetical strategy were to execute all 20 trade signals, there would be some modest diversification benefit, but that would be swamped by the opportunity cost of ignoring position scores.
If we are not going to maximize the level of diversification within strategies, how would we reduce risk? The secret is to diversify across strategies, not within strategies. While some degree of diversification is appropriate for most strategies, the majority of my strategies hold fewer than five positions at any one time. The Trader Edge Asset Allocation Rotational (AAR) strategy only holds a single position, yet has generated outstanding risk-adjusted returns (20%+ per year).
I am currently trading 19 different proprietary strategies. While some are positively correlated, many are not. I have several long/short equity strategies and their results are positively correlated with each other. However, I also have several directional credit spread strategies, a butterfly strategy, two volatility strategies, a futures trend following strategy, two COT-based directional futures strategies, the AAR strategy, and a cash strategy that all have low cross-correlations.
Diversify across strategies, not within strategies, to enhance strategy performance and reap the maximum benefits from diversification.
Feedback
Your comments, feedback, and questions are always welcome and appreciated. Please use the comment section at the bottom of this page or send me an email.
Referrals
If you found the information on www.TraderEdge.Net helpful, please pass along the link to your friends and colleagues or share the link with your social or professional networks.
The "Share / Save" button below contains links to all major social and professional networks. If you do not see your network listed, use the down-arrow to access the entire list of networking sites.
Thank you for your support.
Brian Johnson
Copyright 2013 - Trading Insights, LLC - All Rights Reserved.


