
The following article updates the diffusion index, recession slack index, aggregate recession model, and aggregate peak-trough model through July 2013.
Diffusion Index
The Trader Edge diffusion index equals the percentage of independent variables indicating a recession. There are a total of 16 explanatory variables, each with a unique look-back period and recession threshold. The resulting diffusion index and changes in the diffusion index are used to estimate the probit, logit, and neural network forecasting models.
The graph of the diffusion index from 1/1/2003 to 8/1/2013 is presented in Figure 1 below (in red - left axis). If you would like to view a graph of the earlier historical data (going back to 1960), please revisit A New Recession Slack Indicator. The gray shaded regions in Figure 1 below represent U.S. recessions as defined (after the fact) by the National Bureau of Economic Research (NBER). The value of the S&P 500 index is also included (in blue - right axis).
The percentage of explanatory variables indicating a recession has remained constant at 0% from the end of January 2013 through the end of July. None of the 16 explanatory variables is currently indicating a recessionary environment.
Please note that past estimates and index values will change whenever the historical data is revised. All current and past forecasts and index calculations are based on the latest revised data.
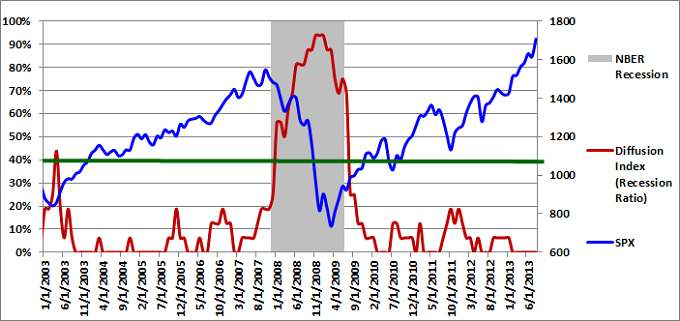
Figure 1: Diffusion Index 08-01-2013
Recession Slack Index
The Trader Edge recession slack index equals the median standardized deviation of the current value of the explanatory variables from their respective recession thresholds. The resulting value signifies the amount of slack or cushion relative to the recession threshold, expressed in terms of the number of standard deviations.
The gray shaded regions in Figure 2 below again represent U.S. recessions as defined (after the fact) by the NBER. The median recession slack index is depicted in purple and is plotted against the right axis, which is expressed as the number of standard deviations above the recession threshold.
The dark-red, horizontal line at 0.50 standard deviations denotes a possible warning threshold for the recession slack index. Many of the past recessions began when the recession slack index crossed below 0.50. Similarly, many of the past recessions ended when the recession slack index crossed back above 0.0.
The latest recession slack index value was 1.12 standard deviations above the recession threshold, up from the revised value of 0.99 at the end of June. The recession slack index had been declining since reaching an interim peak of 1.29 at the end of February, but the increase in July may have halted the negative trend. The recession slack index remains comfortably above the warning threshold.
The ability to track small variations and trend changes over time illustrates the advantage of monitoring the continuous recession slack index in addition to the diffusion index above, which moves in discrete steps and has been unchanged since the end of January.
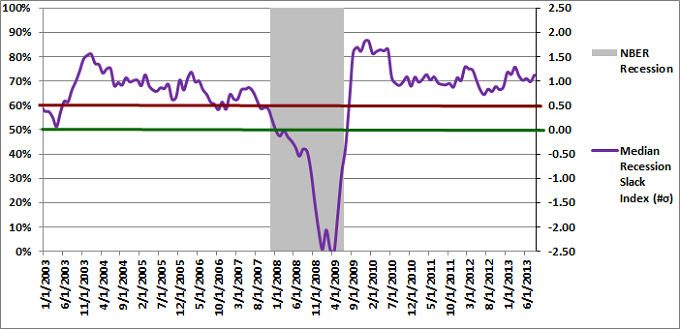
Figure 2: Median Recession Slack Index 08-01-2013
While it is useful to track the actual recession slack index values directly, the values are also used to generate the more intuitive probit and logit probability forecasts.
Aggregate Recession Probability Estimate
The Trader Edge aggregate recession model is the average of four models: the probit and logit models based on the diffusion index and the probit and logit models based on the recession slack index. The aggregate recession model estimates from 1/1/2003 to 8/1/2013 are depicted in Figure 3 below (red line - left vertical axis). The gray shaded regions represent NBER recessions and the blue line reflects the value of the S&P 500 index (right vertical axis). I suggest using a warning threshold of between 30-40% for the aggregate recession model (green horizontal line).
The aggregate recession model probability estimate for 8/1/2013 was 0.0%, which was unchanged from last month's revised estimate. According to the model, the probability that the U.S. is currently in a recession is extremely remote.
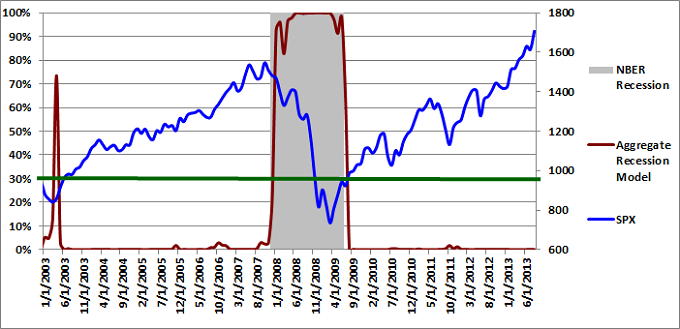
Figure 3: Aggregate Recession Model 08-01-2013
Aggregate Peak-Trough Probability Estimate
The peak-trough model forecasts are different from the recession model. The peak-trough models estimate the probability of the S&P 500 being between the peak and trough associated with an NBER recession. The S&P 500 typically peaks before recessions begin and bottoms out before recessions end. As a result, it is far more difficult for the peak-trough model to fit this data and the model forecasts have larger errors than the recession model.
The Trader Edge aggregate peak-trough model equals the weighted-average of nine different models: the probit and logit models based on the diffusion index, the probit and logit models based on the recession slack index, and five neural network models.
The aggregate peak-trough model estimates from 1/1/2003 to 8/1/2013 are depicted in Figure 4 below, which uses the same format as Figure 3, except that the shaded regions represent the periods between the peaks and troughs associated with NBER recessions. The aggregate peak-trough model probability estimate for 8/1/2013 was 4.1%, which was down slightly from the revised value of 4.8% at the end of June.
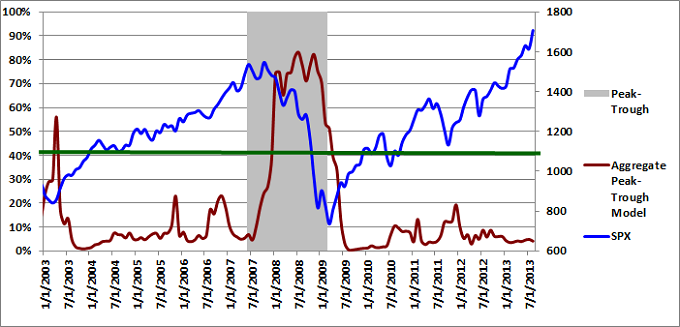
Figure 4: Aggregate Peak-Trough Model 08-01-2013
Conclusion
U.S. recession risk remained very low in June. The recession slack index was still comfortably above its 0.50 warning threshold, but has declined significantly since peaking at the end of February. The increase in July suggests the decline may have halted. The aggregate model forecasts and diffusion index values were still well below their 30%-40% warning levels.
Feedback
Your comments, feedback, and questions are always welcome and appreciated. Please use the comment section at the bottom of this page or send me an email.
Referrals
If you found the information on www.TraderEdge.Net helpful, please pass along the link to your friends and colleagues or share the link with your social or professional networks.
The "Share / Save" button below contains links to all major social and professional networks. If you do not see your network listed, use the down-arrow to access the entire list of networking sites.
Thank you for your support.
Brian Johnson


