
Divergences are simple conceptually. When prices are making higher highs and higher lows and a predictive indicator, such as market breadth, is making lower highs and lower lows, then the indicator has diverged from price and the upward price trend is probably unsustainable. Similarly, when prices are making lower lows and lower highs and a predictive indicator is making higher highs and higher lows, then a bullish trend reversal is likely.
Single instances of divergences are relatively easy to identify visually on a chart, but much more difficult to detect using computer algorithms. As a rule, I only trade strategies that have been proven to generate attractive risk-adjusted returns historically AND have some underlying foundation for those excess returns. I have been thinking about divergence indicators and strategies for years, but had never been able to identify a promising divergence algorithm.
After completing my new book, Option Strategy Risk / Return Ratios, I returned my attention to divergences. I devoted the past month to creating a standardized divergence metric that can be applied to any predictive indicator and used that new tool to develop two new trading strategies, one based on daily data and one derived from weekly data. This article will provide an overview of the framework for the divergence algorithm and will also provide several graphical examples using actual market data.
The Divergence Indicator
When I began my divergence strategy research, I started with three premises:
- Multiple divergences as a function of time are more meaningful than a single instance of a divergence
- Multiple indicators diverging from price are more significant than a single indicator diverging from price
- Trading in the same direction as the prevailing trend would reduce risk and enhance returns
I used these three premises as the foundation for the construction of the divergence indicator and the divergence trading strategies. To address the first premise, I did not just look at the most recent periods when identifying divergent highs and lows, I looked at multiple periods and compared the highs and lows for each period. I then created an standardized divergence metric that aggregated the divergences across a predetermined number of prior periods, assigning more weight to divergences that had persisted for longer periods of time. Positive numbers were used to signify bullish divergences and negative numbers were used to represent bearish divergences.
The divergence indicator aggregates the standardized divergence scores for eight different sub-indicators, which are derived from price, volume, volatility, sentiment, market breadth, relative strength, or some combination thereof. I should also mention that I wrote two separate divergence functions, one for indicators that normally move in the same direction as price and a second function for indicators that typically have an inverse relationship with price. With both functions available, it is possible for me to apply the same divergence algorithm to any sub-indicator and aggregate the results into a single standardized divergence value.
Each one of the sub-indicators measures a different aspect of the market and divergences in every one of the sub-indicators is significantly predictive individually. However, when multiple indicators diverge simultaneously from price over multiple periods, the resulting divergences are highly predictive. When used to trade in the same direction as the prevailing intermediate-term trend, the resulting daily and weekly strategies generate very high probability trades.
Divergence Indicator in Practice
The top panel in Figure 1 below is a daily candlestick chart of the Russell 2000 Index (RUT) from late January 2014 through May 14, 2014. The purple line is an intermediate-term moving average of the closing prices of RUT. The green shaded region in February of 2014 highlights a recent trade from the daily divergence strategy. I plan to use the corresponding futures contract to execute all equity index transactions.
The divergence indicator is depicted in the bottom panel of the chart. The blue and red histogram values represent the number of sub-indicators (out of eight) demonstrating a significant divergence over multiple periods. Blue histogram values represent the number of large positive or bullish divergences and red histogram values represent the number of large negative or bearish divergences.
Horizontal threshold lines are shown at plus two and minus three. These lines indicate that all bullish strategy signals require a minimum of two sub-indicators showing large positive divergences, and all bearish strategy signals require a minimum of three sub-indicators showing large negative divergences.
Finally, the purple line in the bottom panel represents the average divergence level, which is calculated using divergence measures for all eight sub-indicators. Note, the purple line uses a different scale than the histogram bars. Not only does the number of large divergences need to equal or exceed the minimum threshold value, but the average divergence must also remain positive during all bullish trades and remain negative during all bearish trades. Finally, the closing price must be above the moving average to signal a bullish trade and below the moving average to signal a bearish trade.
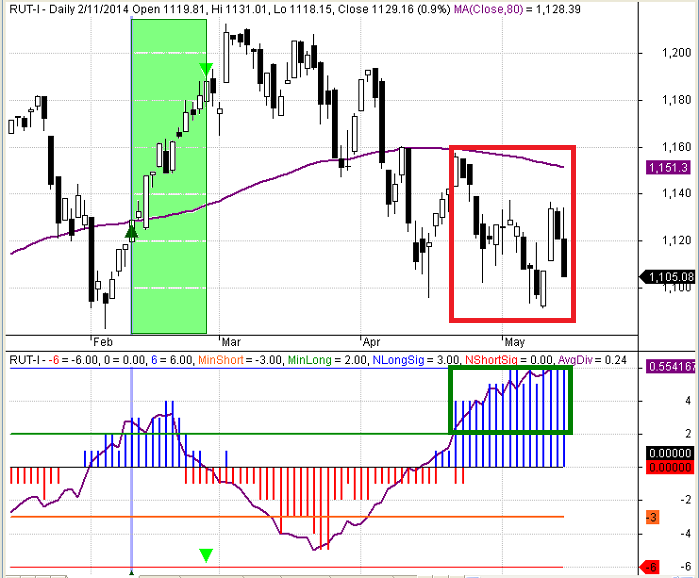
Figure 1: RUT Daily Divergence May 2014
The recent data in RUT is interesting (see Figure 1 above). The number of sub-indicators showing a large bullish divergence has varied between five and six for the last week of daily data, which clearly exceeds the minimum threshold of two (green box above). The average level of divergence over all eight sub-indicators is also positive and very significant. However, the daily divergence strategy has NOT yet signaled a bullish trade. The reason is that the the price of RUT has remained below the intermediate-term moving average (red box above). The daily divergence strategy will not signal a trade until both bullish conditions are met.
Figure 2 below is a daily divergence chart of the S&P 500 Index (SPX). The format and time period are the same as in Figure 1 above. Note, the daily strategy signaled a February 2014 bullish trade in SPX, which corresponded almost exactly to the timing of the bullish signal in RUT. However, the recent picture is quite different.
SPX is not currently showing a bullish divergence. In fact, two of the sub-indicators are currently showing large negative or bearish divergence and no sub-indicator is showing a large positive or bullish divergence. In addition, while the price of RUT has remained below the intermediate-term moving average, the price of SPX has remained above its moving average. It will be interesting to see which of these two indices fires a divergence signal first.
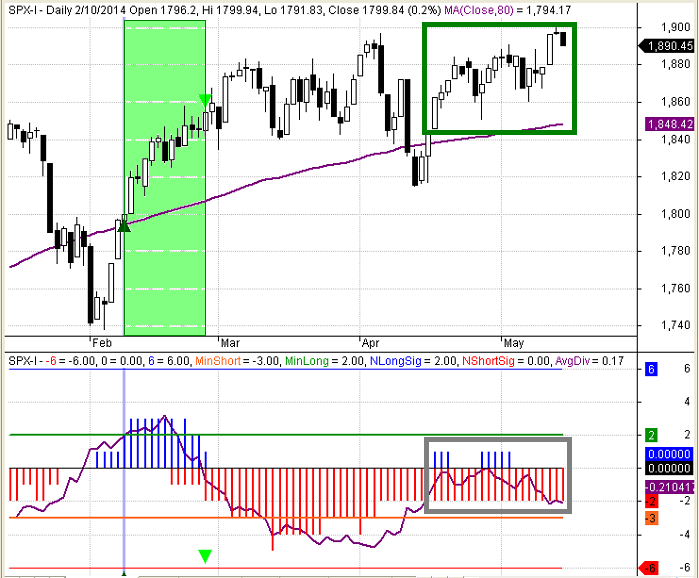
Figure 2: SPX Daily Divergence May 2014
Weekly Divergences
As I explained earlier, I also created a weekly divergence strategy using the same divergence indicator, sub-indicators, and strategy algorithm. The weekly divergence chart for RUT from mid-2008 through late 2009 is depicted in Figure 3 below. The format is the same as in Figures 1 and 2. The weekly divergence strategy fired two bullish weekly signals during this period. The first signal occurred in April of 2008 and lasted seven weeks. The trade is noted by green triangles, but the trade is not shaded.
The second bullish trade signal occurred in early April of 2009 and lasted five weeks. Both trades were profitable. Negative divergences did occur prior to the dramatic price drop in late-2008, but the divergences were not significant enough to generate a high-probability trade signal. Due to the normal bullish bias in equity markets, the criteria for entering bearish trades are more restrictive than the criteria for entering bullish trades.
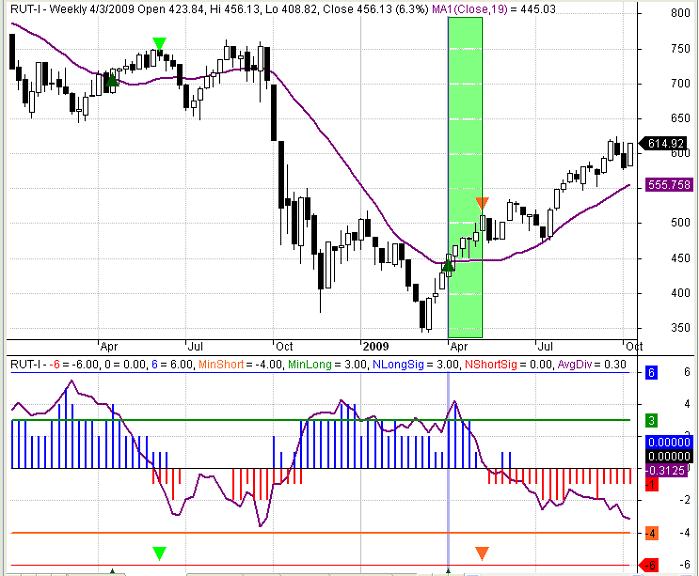
Figure 3: RUT Weekly Divergence 2008
Conclusion
The daily and weekly divergence strategies both generate a high percentage of profitable trades, 77% and 82% respectively. In addition, the size of the average winning trade for both strategies exceeds the size of the average losing trade. The resulting profit factors and Sharpe Ratios are very attractive. Due to their restrictive criteria, neither of the two strategies generates a large number of trades. However, the trade signals that do occur have historically had a very high probability of success, making these strategies easier to trade psychologically.
While some of the sub-indicators could be applied to any underlying security, many are specific to broad-market equity indices, notably breadth, sentiment, and relative strength. As a result, the divergence indicator and resulting divergence strategies are only applicable to equity indices. The divergence indicator uses only one look-back period parameter, so there is very little chance of over-fitting the data. Both strategies use fixed-loss stops to ensure proper risk management and to facilitate position sizing. I plan to use the new strategies to trade futures on SPX(ES), NDX(NQ), and RUT(TF).
Unfortunately, I cannot share the actual code for my proprietary strategies, including the divergence strategies, but the framework that I have described in this article should give you a head-start on developing your own divergence strategies. The ability to apply the same divergence algorithm to any sub-indicator or set of sub-indicators offers remarkable value-added opportunities.
Trader Edge Strategy E-Subscription Now Available: 20% ROR
The Trader Edge Asset Allocation Rotational (AAR) Strategy is a conservative, long-only, asset allocation strategy that rotates monthly among five large asset classes. The AAR strategy has generated approximately 20% annual returns over the combined back and forward test period (1/1/1990 to 7/29/2013). Please use the above link to learn more about the AAR strategy.
Print and Kindle Versions of Brian Johnson's New Book are Now Both Available on Amazon
Feedback
Your comments, feedback, and questions are always welcome and appreciated. Please use the comment section at the bottom of this page or send me an email.
Referrals
If you found the information on www.TraderEdge.Net helpful, please pass along the link to your friends and colleagues or share the link with your social network.
The "Share / Save" button below contains links to all major social networks. If you do not see your social network listed, use the down-arrow to access the entire list of social networking sites.
Thank you for your support.
Brian Johnson
Copyright 2014 - Trading Insights, LLC - All Rights Reserved.


