
I am always on the lookout for new trading tools, indicators, and insights. One of my primary sources of inspiration is magazines like Active Trader and Technical Analysis of Stocks and Commodities. Now that I have finished my first book, I finally have some additional time to investigate new research ideas. I recently read an interesting article in the June 2014 issue of Active Trader by Euan Sinclair titled "Uncertainty as a Predictive Tool." Sinclair concluded that the standard deviation of strike prices in the option chain (as a function of volume) could be used to measure uncertainty or ambiguity, which is predictive of future performance. I was intrigued by the idea and I dedicated some time over the weekend to constructing and testing an uncertainty indicator as a predictor of the performance of the S&P 500 index.
The Uncertainty Indicator
Sinclair referenced a study on a data set of individual stocks in the S&P 500 Index (SPX) and found that "stocks with low ambiguity outperformed the buy-and-hold strategy for the entire market." I rarely trade individual stocks, so I was more interested in whether the indicator could be used to predict the performance of a broad market index. Given that Sinclair's study used individual stocks in the SPX, I decided to conduct my test on the SPX to be as consistent as possible.
Sinclair referenced the standard deviation of strike prices as a function of volume. I started with that concept, but I made a few modifications. First, instead of a standard deviation, which calculates the deviation relative to the average, I calculated the root mean square strike price deviation from the price of the underlying index (the SPX). This value was expressed in dollars, so I divided the result by the price of the SPX, to convert the value to a percentage. I assume Sinclair did a similar transformation as well, but he did not provide the actual formula in his article.
Sinclair's study used all of the options in the matrix with expiration dates of less than one year (no LEAPS). To be as consistent as possible, I used the same filter rules for my SPX calculations. I had some reservations about treating all common strike prices the same, regardless of the expiration date of the options, but I will address that in the next section.
I created a spreadsheet to do the raw ambiguity calculations on SPX options on the last day of each month from December 2009 through May 2014. I then standardized the ambiguity calculations, so that each month-end value could be expressed as the number of standard deviations above or below the mean. The hypothesis was that low levels of ambiguity or uncertainty (negative values) would translate to higher returns of the SPX and high levels of ambiguity (positive values) would result in lower returns of the SPX. To test the hypothesis, I compared the standardized ambiguity values for each month-end to the return of the SPX over the following month. I used the return of the continuous E-mini S&P 500 futures contract (ES) as a proxy for the return of the SPX.
The results are depicted graphically in Figure 1 below. The x-axis represents the standardized ambiguity value and the y-axis represents the subsequent month's return of the ES. The blue diamonds represent the actual observations and the red line depicts the linear relationship between the standardized level of variation in strike prices and the return of the ES. As you can see, the slope of the red line is negative, which is consistent with our hypothesis. Lower levels of ambiguity result in higher returns of the ES. However, the fit is very poor and the magnitude of the errors is proportional to the level of uncertainty.

Figure 1: SPX Strike Percentage Variation versus ES Monthly ROR
As I mentioned above, I was uncomfortable with treating all common strike prices the same, regardless of the expiration dates of the options. The level of uncertainty implied by a one-week option with a strike price $50 above the price of the index is significantly different from the ambiguity implied by a six-month option with a strike price $50 above the price of the index. The expected change in price increases as a function of the square root of time to expiration. The above calculations did not account for this relationship. As a result, I decided to repeat the above procedure using an alternative calculation.
The Risk-Adjusted Uncertainty Indicator
For the revised uncertainty calculation, instead of calculating the deviation of the strike price from the price of the SPX, I calculated the deviation of Delta from 50 (the Deltas of an at-the-money call option) for call options and the deviation of Delta from -50 (the Deltas of an at-the-money put option) for put options. Using the deviation of Delta from the at-the-money Delta automatically adjusts for different levels of volatility on different dates and the difference in the expected price movement as a function of time to expiration. In other words, a Delta of 70 would reflect the same level of ambiguity, regardless of the volatility environment or the expiration date of the option.
Using this modified formula, I performed the same calculations on the same dates and standardized the resulting values using the historical mean and standard deviation. The results are depicted graphically in Figure 2 below. The x-axis represents the standardized ambiguity value and the y-axis represents the subsequent month's return of the ES. The green squares represent the actual observations and the red line depicts the linear relationship between the standardized level of variation in delta and the return of the ES. As you can see, the slope of the red line is negative, which is consistent with our hypothesis and is consistent with our results above. Lower levels of ambiguity result in higher returns of the ES. Unfortunately, the fit is still very poor. In addition, the errors are now inversely proportional to the level of uncertainty (standardized delta deviation as a function of volume).
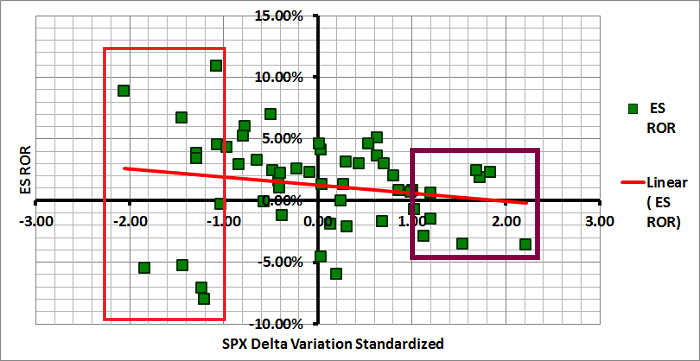
Figure 2: SPX Delta Variation vs ES Monthly ROR
While the strength of the relationship between uncertainty and return is not strong enough to utilize for a strategy, there is one interesting observation that may prove useful. Note that the dispersion of monthly returns in Figure 2 is much greater for low levels of uncertainty than for high levels of uncertainty. The observations in the red box above represent monthly returns when the level of uncertainty was more than one standard deviation below the mean. The returns ranged from approximately -10% to +10%.
Conversely, the observations in the purple box above represent monthly returns when the level of uncertainty was more than one standard deviation above the mean. The returns during high periods of uncertainty ranged from approximately -5% to +5%. In other words, the dispersion of monthly returns was much lower during periods of high uncertainty and much higher during periods of low uncertainty. This conclusion could have significant value for market-neutral option income traders. Option income strategies perform well when realized volatility is low (due to negative Gamma). If this metric could be used to to identify probable periods of high and low realized volatility, we could substantially improve the results of our option income strategies.
Finally, if you would like to get a better sense of how the the standardized Delta variation has evolved, Figure 3 below is a graph of the standardized Delta variation over time. These are the same values used in Figure 2 above.
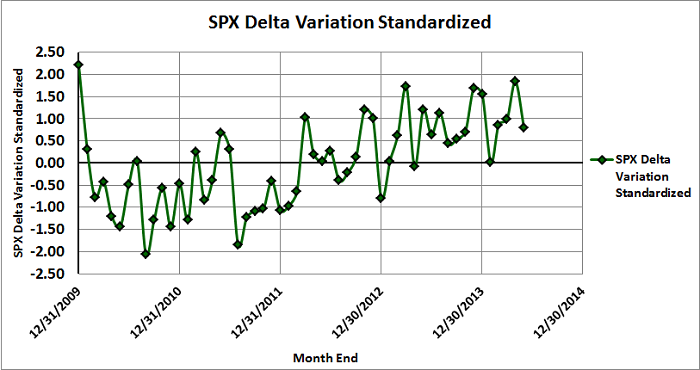
Figure 3: SPX Delta Variation versus Time
Conclusion
One of the keys to being a successful trader is continuing to learn. Sinclair's premise seemed interesting and the results of my research generally support the conclusions in his article. In addition, the revisions I made to his approach forced me to think about the most consistent way to quantify the variation in strike prices. Unfortunately, the strength of the relationship between uncertainty and performance was not sufficient for directional trading purposes. However, the inverse relationship between uncertainty and return dispersion might prove to be more useful.
Print and Kindle Versions of Brian Johnson's New Book are Now Both Available on Amazon
Trader Edge Strategy E-Subscription Now Available: 20% ROR
The Trader Edge Asset Allocation Rotational (AAR) Strategy is a conservative, long-only, asset allocation strategy that rotates monthly among five large asset classes. The AAR strategy has generated approximately 20% annual returns over the combined back and forward test period (1/1/1990 to 7/29/2013). Please use the above link to learn more about the AAR strategy.
Feedback
Your comments, feedback, and questions are always welcome and appreciated. Please use the comment section at the bottom of this page or send me an email.
Referrals
If you found the information on www.TraderEdge.Net helpful, please pass along the link to your friends and colleagues or share the link with your social network.
The "Share / Save" button below contains links to all major social networks. If you do not see your social network listed, use the down-arrow to access the entire list of social networking sites.
Thank you for your support.
Brian Johnson
Copyright 2014 - Trading Insights, LLC - All Rights Reserved.


Pingback: The Whole Street’s Daily Wrap for 6/26/2014 | The Whole Street