
This article presents the Trader Edge aggregate neural network model forecast for the April 2015 non-farm payroll data, which is scheduled to be released tomorrow morning at 8:30 AM EDT.
Non-Farm Payroll (NFP) Model Forecast - April 2015
The Trader Edge aggregate NFP model represents the average of three neural network forecasting models, each of which employs a different neural network architecture. Unlike expert systems, neural networks use algorithms to identify and quantify complex relationships between variables based on historical data. All three models derive their forecasts from seven explanatory variables and the changes in those variables over time.
The table in Figure 1 below includes the monthly non-farm payroll data for two months: March and April 2015. The March data was released last month and the non-farm payroll data for April 2015 will be released tomorrow morning at 8:30 AM EDT.
The model forecasts are in the third data row of the table (in blue). Note that past and current forecasts reflect the latest values of the independent variables, which means that forecasts will change when revisions are made to the historical economic data.
The monthly standard error of the model is approximately 77,100 jobs. The first and last data rows of the table report the forecast plus 0.5 standard errors (in green) and the forecast minus 0.5 standard errors (in red), respectively. All values are rounded to the nearest thousand. If the model errors were normally distributed, roughly 31% of the observations would fall below -0.5 standard errors and another 31% of the observations would exceed +0.5 standard errors.
The actual non-farm payroll release for March 2015 is in the second data row of the table (in purple). The consensus estimate (reported by Briefing.com) for April 2015 is also in the second data row of the table (in purple). The reported and consensus NFP values also include the deviation from the forecast NFP (as a multiple of the standard error of the estimate). Finally, the last column of the table includes the estimated changes from March 2015 to April 2015.
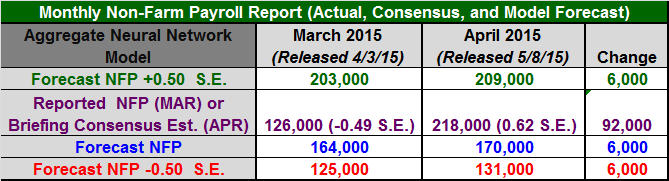
Figure 1: Non-Farm Payroll Table April 2015
Model Commentary
The aggregate neural network model forecast for April is 170,000, which is up 6,000 jobs from last month's revised forecast of 164,000. The very small increase in the forecast from March to April reflects an unchanged employment environment during the month of April. The Briefing.com consensus estimate for April is 218,000, which is up sharply (+92,000 jobs) from the March report, indicating a significant strengthening in the employment environment. The actual March data was below than the revised March forecast (-0.49 S.E.). The consensus estimate for April is materially above the model forecast (+0.62 S.E.).
If we ignore the large NFP outliers, there had been a gradual and sustained positive trend in the employment data from mid-2012 through January of 2015. The trend is easier to see in the forecast data due to fewer outliers. To test the strength of the trend that began in mid-2012, a few months ago I ran a simple linear regression on the monthly NFP forecast data (dependent variable) against time (independent variable).
The R-squared of the linear regression was 56%, indicating that 56% of the variation in the forecast data was explained by the simple linear trend model. The coefficient for the monthly slope variable was 3.12, which represented an incremental increase of 3,100 jobs per month. The slope coefficient was highly significant with a t-statistic of 6.41 and a P-value of 3.31E-07. The standard error of the model was 27,850 jobs.
The simple linear regression model cannot be used long-term due to the cyclical nature of employment, but it can be useful for quantifying short-term trends in the data. The linear regression model forecast for April 2015 is 274,000 which is much higher than the aggregate model forecast of only 170,000.
The positive trend in the model forecasts has definitely leveled off and there is increasing evidence that the trend has started to reverse direction. The April data will be very important in evaluating the status of the trend. The recent divergence between the short-term linear regression forecast and the more sophisticated and adaptive aggregate model forecast is troubling and suggests a weakening or reversal in the positive employment growth trend that has been in place since mid-2012.
The difference between the April NFP consensus and April NFP forecast suggests an increased probability of an downside surprise tomorrow. However, the fact that the March NFP data was below the model forecast may reduce that probability. Errors in NFP data tend to reverse in subsequent months.
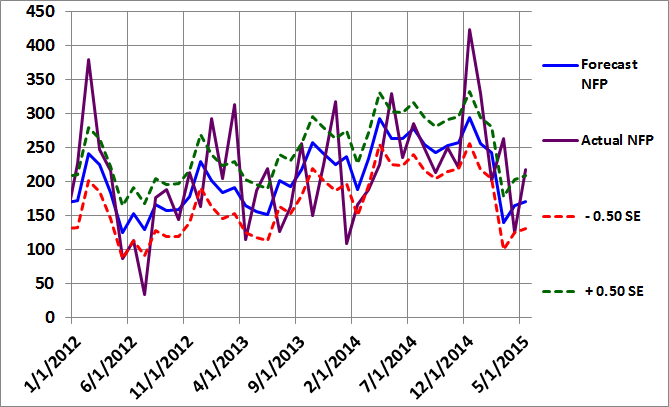
Figure 2: Non-Farm Payroll Graph April 2015
Summary
Basic forecasting tools can help you identify unusual consensus economic estimates, which often lead to substantial surprises and market movements. Identifying such environments in advance may help you protect your portfolio from these corrections and help you determine the optimal entry and exit points for your strategies.
In the case of the NFP data, the monthly report data is highly variable and prone to substantial revisions. As a result, having an independent and unbiased indicator of the health of the U.S. job market is especially important.
Print and Kindle Versions of Brian Johnson's 2nd Book are Available on Amazon
Print and Kindle Versions of Brian Johnson's 1st Book are Available on Amazon (35 5-Star Reviews)
Trader Edge Strategy E-Subscription Now Available: 20% ROR
The Trader Edge Asset Allocation Rotational (AAR) Strategy is a conservative, long-only, asset allocation strategy that rotates monthly among five large asset classes. The AAR strategy has generated annual returns of approximately 20% over the combined back and forward test period. Please use the above link to learn more about the AAR strategy.
Feedback
Your comments, feedback, and questions are always welcome and appreciated. Please use the comment section at the bottom of this page or send me an email.
Referrals
If you found the information on www.TraderEdge.Net helpful, please pass along the link to your friends and colleagues or share the link with your social or professional networks.
The "Share / Save" button below contains links to all major social and professional networks. If you do not see your network listed, use the down-arrow to access the entire list of networking sites.
Thank you for your support.
Brian Johnson
Copyright 2015 - Trading Insights, LLC - All Rights Reserved.


