
I made a number of significant improvements to the recession model in January of 2020. If you missed the January recession model post, or if you would like to review the improvements to the models, please revisit the Recession Model Forecast: 01-01-2020. In the following months, I reduced the number of input variables in all of the peak-trough neural network models and expanded the number of individual models. I also further constrained the models, which made them even more robust - especially when interpreted as a single aggregate peak-trough forecast. Finally, due to the very large discrete changes in the economic data due to COVID-19, I capped the maximum standardized deviation above the recession threshold, which is particularly important when reporting the mean standardized deviation. No changes were made to any of the explanatory variables.
Unfortunately, I have been unable to publish the recession model update for the last two months. I have been swamped finalizing and rolling out 32-bit and 64-bit versions of a new comprehensive option volatility forecasting platform called AI Volatility Edge (AIVE). I devoted the last year to designing AI Volatility Edge - which is an integrated collection of AI models based on the latest machine-learning (ML) algorithms. The AI Volatility Edge platform is available on a subscription basis for professional and non-professional option traders. Please see my initial post for more information about AI Volatility Edge.
Monthly Update
This article updates the diffusion indices, recession slack index, aggregate recession model, and aggregate peak-trough model through November 2020.
The current 26-variable model has a diverse set of explanatory variables and is quite robust. Each of the explanatory variables has predictive power individually; when combined, the group of indicators is able to identify early recession warnings from a wide range of diverse market-based, fundamental, technical, and economic sources.
Several of the explanatory variables are market-based. These variables are available in real-time (no lag), which means they respond very quickly to changing market conditions. In addition, they are never revised. This makes the Trader Edge recession model more responsive than many recession models. The current and historical data in this report reflect the current model configuration with all 26 variables.
Diffusion Index
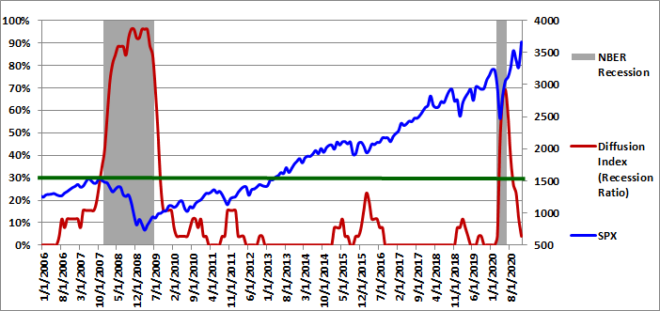
The Trader Edge diffusion index equals the percentage of independent variables indicating a recession. With the latest changes, there are now a total of 26 explanatory variables, each with a unique look-back period and recession threshold. The resulting diffusion index and the trend in the diffusion index are two of the variables used to estimate the probit, logit, and neural network model forecasts.
The graph of the diffusion index from 1/1/2006 to 12/1/2020 is presented in Figure 1 below (in red - left axis). The gray shaded regions in Figure 1 below represent U.S. recessions as defined (after the fact) by the National Bureau of Economic Research (NBER). The NBER has not yet called the end of the 2020 recession, so I have entered a temporary end date in all graphs below. The value of the S&P 500 index is also included (in blue - right axis).
COVID-19 and the resulting carnage from closing the economy hit the market in full-force in late February of 2020. The market plummeted in March, but has since staged the fastest recovery on record - surpassing the pre-COVID all-time highs in the S&P 500 and NASDAQ 100 Index.
The number of explanatory variables indicating a recession decreased from 3 (11.5%) to 1 (3.8%) in November, which was due to the continued rebound in the prices of risk-assets as well as the continued improvement in most economic indicators - as the U.S. economy continued to expand.
Please note that past estimates and index values will change whenever the historical data is revised and/or whenever model improvements are implemented. All current and past forecasts and index calculations are based on the most recent models using the latest revised data from the current data set.
0.5-Sigma Diffusion Index
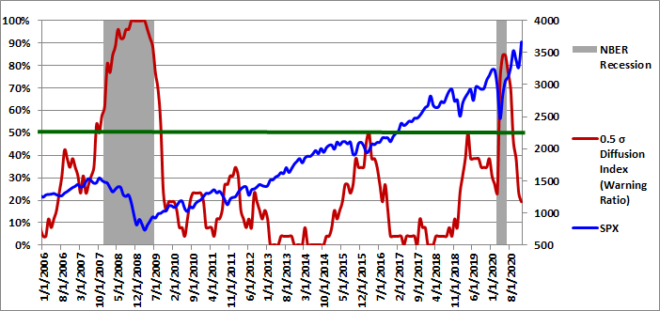
The Trader Edge 0.5-sigma diffusion Index equals the percentage of explanatory variables with Z-scores that are less than 0.5 standard deviations above their respective recession thresholds. This new diffusion index is much more sensitive than the standard (zero-sigma) diffusion index. As a result, it provides much more detail on the health of the U.S. economy. The new 0.5-sigma diffusion index and the trend in the new diffusion index are two of the variables used to estimate the probit, logit, and neural network model forecasts.
The graph of the 0.5-sigma diffusion index from 1/1/2006 to 12/1/2020 is presented in Figure 2 below (in red - left axis). The gray shaded regions in Figure 2 below represent U.S. recessions as defined (after the fact) by the National Bureau of Economic Research (NBER). The value of the S&P 500 index is also included (in blue - right axis).
The percentage of explanatory variables with Z-scores below the 0.5-sigma early warning threshold declined from 36.4% to 24.1% in November. The additional level of detail provided by this more continuous and responsive metric is particularly valuable in the months leading up to or emerging from a recession, especially given the infrequent and more discrete movements of the standard (zero-sigma) diffusion index.
As I noted in past months, the percentage of variables with Z-scores below their respective 0.5 sigma thresholds had been unusually high before the recession, especially with the standard diffusion index equal to zero. This significantly reduced the potential cushion to any adverse economic shocks and accelerated the decline due to the Coronavirus.
This new 0.5-sigma diffusion index and the trend in the new diffusion index are now both used directly in the neural network recession models. When combined with the recession slack indices, the new diffusion index provides even greater insight into rapidly changing conditions.
Recession Slack Indices
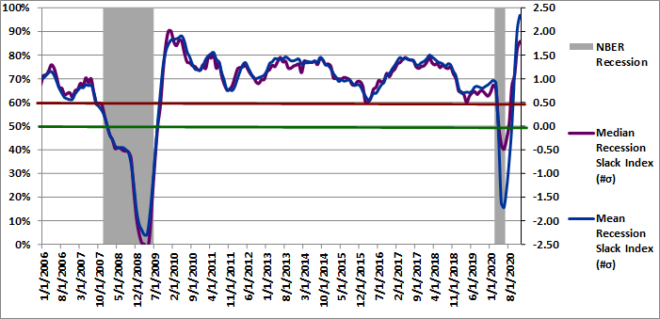
The Trader Edge recession slack index equals the median standardized deviation of the current value of the explanatory variables from their respective recession thresholds. The resulting value signifies the amount of slack or cushion relative to the recession threshold, expressed in terms of the number of standard deviations. Higher slack values signify larger cushions above recessionary threshold levels. While the median recession slack index is used in the recession models, I am now including the mean recession slack index in the graph as well. As I mentioned above, I am now capping the maximum standardized deviation for each explanatory variable before calculating the mean and median. I use both of these values in the neural network models and in the probit and logit models.
The gray shaded regions in Figure 3 below represent U.S. recessions as defined (after the fact) by the NBER. The median recession slack index is depicted in purple and is plotted against the right axis, which is expressed as the number of standard deviations above the recession threshold. The mean recession slack index is depicted in blue and is also plotted against the right axis.
The dark-red, horizontal line at 0.50 standard deviations denotes a possible warning threshold for the recession slack index. Many of the past recessions began when the recession slack index crossed below 0.50. Similarly, many of the past recessions ended when the recession slack index crossed back above 0.0.
In November 2020, the median recession slack index increased from +1.63 to +1.79. The mean recession slack index (affected more by outliers - even when capped) jumped from +2.04 to +2.34. Similar to the situation with the 0.5-sigma diffusion index, the mean and median slack indices had been unusually low before the recession. This made the U.S. economy particularly vulnerable to any adverse economic shocks, which accelerated the decline due to the Coronavirus. Note, all of these values reflect the new smoothed trend data.
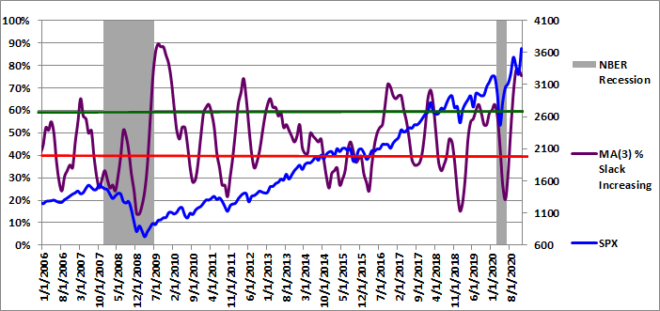
To gain further insight into the slack index, I provide the three-month moving average of the percentage of variables with increasing slack in Figure 4, but I personally monitor the monthly percentages as well.
Slack is a standardized value, so it is directly comparable across all variables. More slack indicates a larger cushion relative to a recessionary environment. As a result, we would like to see as many variables as possible with increasing slack. Given the diverse nature of the explanatory variables, it is unusual to see more than 60% of the variables with increasing slack or fewer than 40% of the variables with increasing slack. These extreme values are significant and predictive of the near-term direction of economic growth and often the equity market.
The 3-month moving average of the percentage of variables with increasing slack declined slightly from 78.2% to 75.6% in November. These values are remarkably high, reflecting the sharp rebound in the economy. New evidence of economic weakness (or strength) often shows up first in this timely metric.
The ability to track small variations and trend changes over time illustrates the advantage of monitoring the continuous recession slack index. The new slack variable provides additional insight into the near-term direction of the economy and should be used in conjunction with the median recession slack index.
While it is useful to track the actual recession slack index values and percentage of variables with increasing slack, the diffusion percentages and slack index values are also used to generate the more intuitive probit and logit probability forecasts.
Aggregate Recession Probability Estimate
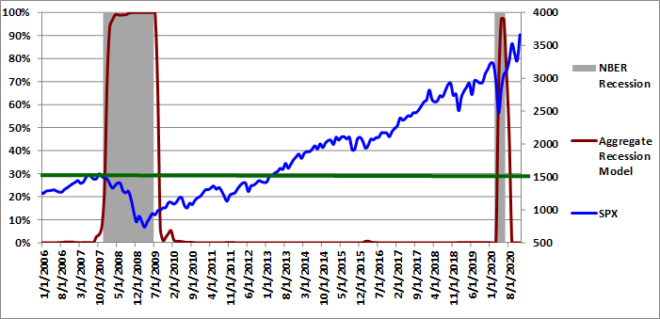
The Trader Edge aggregate recession model averages the estimates from probit and logit models derived from the level and trend in a subset of the four variables described above: the original diffusion index, the 0.5-sigma diffusion index, the slack indices, and the percentage of variables with increasing slack. The aggregate recession model estimates from 1/1/2006 to 12/01/2020 are depicted in Figure 5 below (red line - left vertical axis). The gray shaded regions represent NBER recessions and the blue line reflects the value of the S&P 500 index (right vertical axis). I suggest using a warning threshold of between 20-30% for the aggregate recession model (green horizontal line).
The aggregate recession model probability estimate remained at 0.0% in November. It is highly likely that the U.S. economy has bottomed and already emerged from the recession - albeit at a significantly lower level of economic output.
Aggregate Peak-Trough Probability Estimate
The peak-trough model forecasts are different from the recession model and are much more responsive. The peak-trough models estimate the probability of the S&P 500 being between the peak and trough associated with an NBER recession. The S&P 500 typically peaks before recessions begin and bottoms out before recessions end. As a result, it is far more difficult for the peak-trough model to fit this data and the model forecasts have larger errors than the recession model.
The Trader Edge aggregate peak-trough model is a weighted-average of the estimates from a number different neural network models, all of which use the levels and trends of the diffusion and slack indices described above.
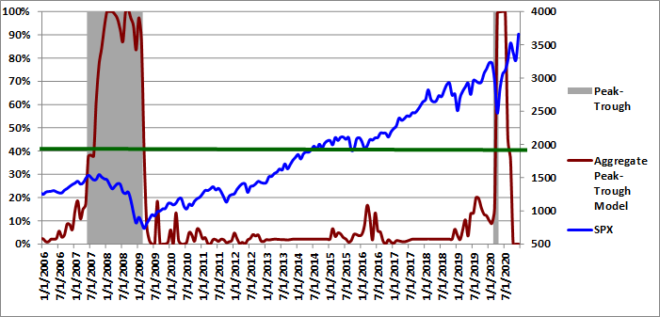
The aggregate peak-trough model estimates from 1/1/2006 to 12/01/2020 are depicted in Figure 6 below, which uses the same format as Figure 5, except that the shaded regions represent the periods between the peaks and troughs associated with NBER recessions. The value of the S&P 500 index is also included (in blue - right axis).
The aggregate peak-trough model probability estimate for 12/01/2020 was 0.0%, which remained constant in November.
It is important to note that all of the recession models were designed to identify "typical" recessions, with gradual weakening metrics preceding the recession and gradual strengthening metrics as the economy emerges from the recession. The models use trends in the data, but these trend changes in the COVID-19 recession were much more rapid due to the discrete nature of economic restrictions imposed by federal and state governments to limit the spread of COVID-19. I was initially concerned that this could be a particular challenge for the models when exiting the current recession, but the models have been much more responsive than initially anticipated and have performed remarkably well in this very unique environment.
Conclusion
The November diffusion indices, slack indices, and the recession model forecasts all indicate the COVID-19 recession is over. The diffusion index decreased from 3 (11.5%) to 1 (3.8%) in November. The new 0.5-sigma diffusion index dropped from 36.4% to 24.1%. The median and mean recession slack indices were +1.79 and +2.34 respectively. The moving average of explanatory variables with increasing slack dropped very slightly from a very elevated 78.2% to 75.6 in November. The aggregate recession probability and aggregate peak-trough probabilities were both unchanged in November at 0.0%.
Typically, the environment after emerging from a recession offers very attractive buying opportunities for equities with high risk-adjusted expected returns. Valuation levels are usually very low due to elevated risk premiums. In addition, near-term growth rates following a recession are usually high. Unfortunately, the current environment is very different.
Based on the most recent data, the equity allocation percentage regression model indicates that the expected annual price return of the S&P 500 index for the next 10 years remains extremely low at -1.26% with an expected drawdown in that period of 38% (from 12/1/2020 levels). The low expected future return is due to the sharp rebound in equity prices since March 23rd. Expected future equity returns are still quite low in a historical context, especially given the near-term market, political, economic, and virus-related uncertainty.
The "Buffett Indicator" is widely followed as an equity valuation metric. I read a recent article that reported the Buffett Indicator is now higher than it has ever been in the past. My own calculations support this conclusion, even when applying the aggressive Atlanta GDP Now Cast growth rate of 11% for Q4 2020 to the indicator calculation. It is never a good idea to extrapolate outside the historical sample data with a regression model. As a result, we cannot put a lot of confidence in the estimated annual price return of -11% and estimated drawdown of 73% (from 12/1/2020 levels) for the S&P 500 index over the next 10 years, but the estimates are still alarming.
History offers compelling evidence that bullish equity positions today will face depressed returns over the coming years.
Unlike human prognosticators, the Trader Edge recession models are completely objective and have no ego. They are not burdened by the emotional need to defend past erroneous forecasts and will always consistently apply the insights gained from new data.
Brian Johnson
Copyright 2020 Trading Insights, LLC. All rights reserved.
AI Volatility Edge Platform: E-Subscription
Option Income Strategy (OIS) Universal Filter: E-Subscription


I just love your work. I am excited to read your new book once it is released, and then re-reading it.
I must confess, I feel like a kid who just got a Red Rider bee-bee gun for Christmas. I just hope I don’t shoot my eye out.
Regards,
Wilf