I read about this strategy in an article titled "The Low-Close Edge," which appeared in the December 2012 issue of Active Trader. The article was written by Nat Stewart. Stewart introduced a very simple, systematic, long-only equity strategy that generated remarkable returns, while only being invested in the market a fraction of the time. I was so surprised by the 44% return reported in 2008, that I programmed the strategy in AmiBroker and tested it myself. My results were even higher!
The Low-Close Strategy
Stewart presented several different versions of the low-close strategy in the article, but I will focus exclusively on the one with the highest reported returns. The concept is simple: buy the SPY when it closes in the bottom 50% of its daily range AND in the bottom 50% of its 5-day range. When it closes in the top 50% of its daily range OR in the top 50% of its 5-day range, liquidate the SPY position and return to cash. It doesn't get much simpler than that.
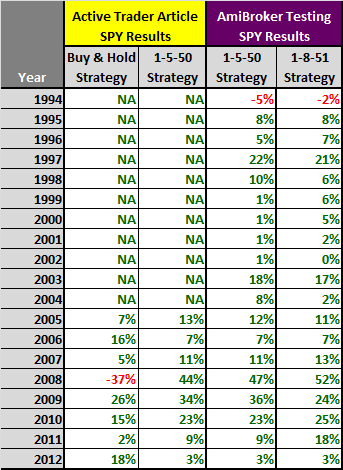
Stewart reported the 2005-2012 (through 9-19-2012) SPY buy and hold and low-close "1-5-50" returns in the Active Trader article. The 1-5-50 represents the 1-day range, the 5-day range, and the bottom 50% decision parameters. The returns from the article are listed in the first two columns in Figure 1.
My AmiBroker returns for the SPY 1-5-50 strategy from 1994-2012 are provided in the third column. As you can see, the returns are very similar to those reported in the article. I used daily data for the SPY, back-adjusted for dividends.
Finally, I decided to optimize the strategy by adjusting the longer-term look-back period and the buy/sell range threshold. The optimal parameters were 1-8-51: purchases were made when the SPY closed in the bottom 51% of its daily range AND in the bottom 51% of its 8-day range. All strategy returns exclude transaction costs and assume a 0% return on cash investments.
Remarkably, the low-close models only had one negative calendar-year return in the entire 19-year historical period. Neither of the low-close strategies earned negative calendar year returns in either of the last two recessions.
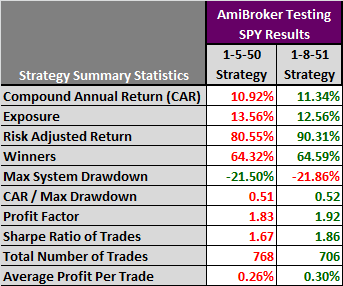
Looking at annual returns is interesting, but it is much more instructive to look at the summary statistics for the entire 1994-2012 period (Figure 2). As you would expect, the optimized strategy dominated the un-optimized strategy in virtually every category, but the parameters were not radically different. The optimized strategy used a slightly longer look-back period (eight day versus five days) and the thresholds were very similar (51% versus 50%).
Let's focus on the optimized strategy. The 19-year compound annual return of 11.34% was attractive, but was even more remarkable considering the strategy was only invested 12.56% of the time. The resulting risk adjusted return was 90.31%, which was a highly efficient use of capital.
The strategy would have suffered a drawdown of 21.86%, which led to a CAR / Max Drawdown ratio of only 0.52%. I would prefer to see this value above 1.0. The profit factor of 1.92 was also lower than I would like, but clearly demonstrated excess returns. In addition, the Sharpe ratio of 1.86 was very attractive.
Practical Considerations
While the low-close strategy generated higher returns than buy and hold investing with much lower risk, there are several issues to consider before employing this type of approach. First, I would never consider a strategy that did not have a maximum stop-loss limit on every trade, especially one that trades against the trend.
Without a maximum stop-loss amount, it would be impossible to calculate the required position size to limit losses to a desired percentage of total capital. I tested the strategy with various percentage stop-loss levels and the results were invariably worse than those reported above, but I would still not consider trading any strategy without proper risk management.
Second, this strategy would be very difficult to trade from a psychological perspective. It is much easier to trade with the trend: buying when the market advances and selling when the market declines. While I acknowledge the above returns are compelling, most traders would find it very difficult to buy when the market is at the low end of its 1-day and 8-day ranges, especially during an extreme bear market like 2008.
Finally, the above returns do not include transaction costs and the strategy was very active, generating 706 round-trip trades during the testing period. The strategy only earned 0.30% per trade before transaction costs. The bid-ask spread and commissions would have reduced this number even further.
While I do not plan on trading this strategy, it did open my eyes to the surprisingly strong performance of the market after short-term pullbacks. It definitely warrants additional research.
Feedback
Your comments, feedback, and questions are always welcome and appreciated. Please use the comment section at the bottom of this page or send me an email.
Do you have any questions about the material? What topics would you like to see in the future?
Referrals
If you found the information on www.TraderEdge.Net helpful, please pass along the link to your friends and colleagues or share the link with your social or professional networks.
The "Share / Save" button below contains links to all major social and professional networks. If you do not see your network listed, use the down-arrow to access the entire list of networking sites.
Thank you for your support.
Brian Johnson
Copyright 2012 - Trading Insights, LLC - All Rights Reserved.


Compelling stuff as usual Brian. Regarding the following…
…just wondering if strategy returns exclude or include dividend distributions.
Cheers!
-Bill
Bill,
Good to hear from you again.
The returns implicitly include dividends. What I mean by that is that I use percentage back-adjusted price data for all of my stock, ETF, and futures data. Instead of adding in the dividend payments when calculating returns, the discrete price drop due to each dividend payment is eliminated by using a percentage back-adjustment. The resulting returns should be almost exactly the same as explicitly adding in the dividend payment and using the actual (unadjusted) prices. Back-adjusting the price data also eliminates the undesirable and unrealistic discrete changes in technical indicators.
This is the same process that is used to create continuous futures contracts for historical futures pricing (due to the discrete rolls from one contract to the next). The resulting percentage back-adjusted price data is ideal for developing, testing, and trading systematic strategies.
With respect to the strategy, I am still surprised that a long-only equity strategy could earn a return of 44%+ in 2008.
Best Regards,
Brian Johnson
Thanks Brian. Always very appreciative of your thorough responses!
Use of dividend-adjusted historical data is another subject I’ve grappled with often in recent months. Your feedback is *hugely* helpful.
All the best,
-Bill
Bill,
Glad I could help. If you decide to back-adjust your data (stocks and/or futures), it is important to use percentage adjustments, not dollar adjustments.
Percentage adjustments preserve the historical periodic returns; dollar adjustments do not. In addition, dollar adjustment can distort or change historical technical signals, which can make it impossible do develop and test systematic strategies.
Best regards,
Brian Johnson
Yes, that’s precisely the problem I’ve had with it. Out of curiosity, does Amibroker provide you that adjusted data, are you sourcing it from a third party, or are you adjusting it yourself? I don’t think my data provider (Xignite) offers percentage adjustments of historical records…..could be wrong about that though, so will double check….
Bill,
CSI is my primary data source and they back-adjust the stock, ETF, and futures data. They offer several different back-adjustment methods and various rolling rules for constructing continuous futures contracts. You will find a link to CSI under the affiliate section in the right sidebar of this site. They are well known in the industry for having very high quality historical data.
I download the data from CSI daily and import it into AmiBroker.
Best regards,
Brian Johnson
Thanks again Brian. Will check them out.
Cheers!
-Bill