
This article presents the Trader Edge aggregate neural network model forecast for the May 2014 non-farm payroll data, which is scheduled to be released tomorrow morning at 8:30 AM EDT.
Non-Farm Payroll (NFP) Model Forecast - May 2014
The Trader Edge aggregate NFP model represents the average of three neural network forecasting models, each of which employs a different neural network architecture. Unlike expert systems, neural networks use algorithms to identify and quantify complex relationships between variables based on historical data. All three models derive their forecasts from seven explanatory variables and the changes in those variables over time.
The table in Figure 1 below includes the monthly non-farm payroll data for two months: April and May 2014. The April data was released last month and the non-farm payroll data for May 2014 will be released tomorrow morning at 8:30 AM EDT.
The model forecasts are in the third data row of the table (in blue). Note that past and current forecasts reflect the latest values of the independent variables, which means that forecasts will change when revisions are made to the historical economic data.
The monthly standard error of the model is approximately 84,200 jobs. The first and last data rows of the table report the forecast plus 0.5 standard errors (in green) and the forecast minus 0.5 standard errors (in red), respectively. All values are rounded to the nearest thousand. If the model errors were normally distributed, roughly 31% of the observations would fall below -0.5 standard errors and another 31% of the observations would exceed +0.5 standard errors.
The actual non-farm payroll release for April 2014 is in the second data row of the table (in purple). The consensus estimate (reported by Briefing.com) for May 2014 is also in the second data row of the table (in purple). The reported and consensus NFP values also include the deviation from the forecast NFP (as a multiple of the standard error of the estimate). Finally, the last column of the table includes the estimated changes from April to May 2014.
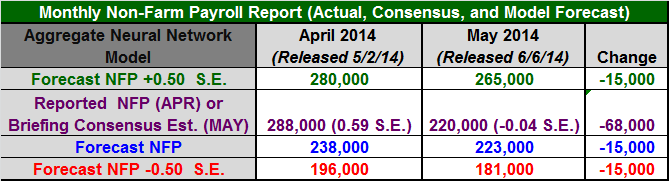
Figure 1: Non-Farm Payroll Table May 2014
Model Commentary
The aggregate neural network model forecast for May is 223,000, which is down 15,000 jobs from last month's revised forecast of 238,000. The Briefing.com consensus estimate for May is 220,000. The actual April data was notably higher than the revised April forecast (+0.59 S.E.) and the consensus estimate for May is almost exactly equal to the model forecast (-0.04S.E.).
If we ignore the extraordinary outlier in January (-2.06S.E), there has been a discernible positive trend in the employment data since late 2012. Not surprisingly, the variation in the actual NFP reports is much wider than the variation in the NFP forecasts. Unfortunately, the Government reports are notoriously noisy, so the trend is more apparent in the forecast data, which are based on several different economic variables that collectively give a much more accurate and reliable employment reading than the Government data. Given that the consensus estimate for May is almost exactly equal to the model forecast, there is little evidence to support a significant surprise tomorrow.
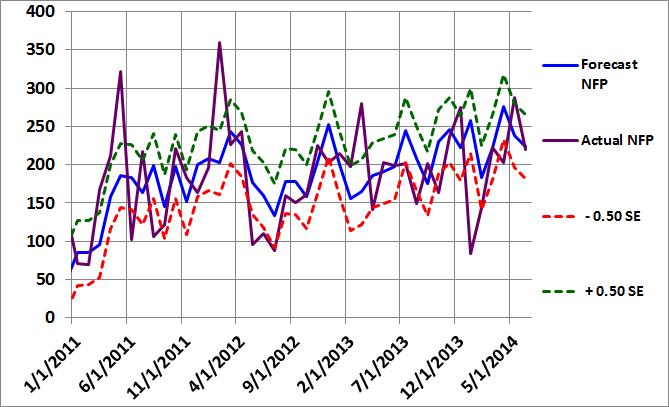
Figure 2: Non-Farm Payroll Graph May 2014
Summary
Basic forecasting tools can help you identify unusual consensus economic estimates, which often lead to substantial surprises and market movements. Identifying such environments in advance may help you protect your portfolio from these corrections and help you determine the optimal entry and exit points for your strategies.
In the case of the NFP data, the monthly report is notoriously unreliable and prone to substantial revisions. As a result, having an independent and unbiased indicator of the health of the U.S. job market is especially important.
Trader Edge Strategy E-Subscription Now Available: 20% ROR
The Trader Edge Asset Allocation Rotational (AAR) Strategy is a conservative, long-only, asset allocation strategy that rotates monthly among five large asset classes. The AAR strategy has generated 20%+ annual returns over the 20+ year combined back and forward test period. Please use the above link to learn more about the AAR strategy.
Print and Kindle Versions of Brian Johnson's New Book are Now Both Available on Amazon
Feedback
Your comments, feedback, and questions are always welcome and appreciated. Please use the comment section at the bottom of this page or send me an email.
Referrals
If you found the information on www.TraderEdge.Net helpful, please pass along the link to your friends and colleagues or share the link with your social or professional networks.
The "Share / Save" button below contains links to all major social and professional networks. If you do not see your network listed, use the down-arrow to access the entire list of networking sites.
Thank you for your support.
Brian Johnson
Copyright 2014 - Trading Insights, LLC - All Rights Reserved.


