
Many traders use technical and/or fundamental data, but few traders have discovered the unique benefits of using sentiment data in their investment process. Sentiment data attempts to quantify the emotional mood of investors and traders and can be used as a very effective contra-indicator. When traders are unusually complacent and overly bullish, markets tend to pull back. Conversely, when traders panic and emotions are running high, this often indicates a potential bottom and an attractive buying opportunity. The following article presents a unique and troubling sentiment warning signal from a recent proprietary research report from SentimenTrader.
SentimenTrader Research Study
I have a paid subscription to SentimenTrader, which supplies data that I use in several of my algorithmic trading strategies, but I am not otherwise affiliated with SentimenTrader. Last Friday, SentimenTrader published an interesting proprietary research study that they have allowed me to share on Trader Edge. It is a representative example of how to use market sentiment and it generated a unique warning signal that is not reflected in other data. This particular signal reflects an extreme divergence (+ 2 standard deviations (SD)) between the VIX index and the Credit Suisse index of high-yield bond spreads.
In early September, I wrote an article ("Widening Junk Bond Spreads: Bull Market in Peril") that explained how widening corporate bond spreads could be used as an effective leading indicator for the economy and the stock market:
"Corporate bond investors are highly sensitive to weakening economic conditions. This is especially true of junk bond investors. Unlike equity investors who participate directly in the growth of earnings and dividends, the upside for corporate bond investors is limited. Either you receive your coupon and principal payments or you don't. Sure, spreads could narrow, but the probability of receiving your future payments is of paramount importance.
Therefore, junk bond investors are highly focused on quantifying and forecasting downside risk, while equity analysts can be temporarily blinded by the unlimited upside potential of their favorite stocks. As a result, perceived increases in default risk show up in widening junk bond spreads, often before they emerge in equity prices."
VIX Diverges from Credit Spreads
The SentimenTrader research article takes this idea one step further. It examines the divergence between the VIX index and the Credit Suisse Index of high-yield bonds. The VIX index reflects the expected level of volatility (risk) in the equity market and is derived from the prices of options on the S&P 500 index. The Credit Suisse Index of high-yield bonds reflects the level of excess compensation demanded by high-yield bond holders for accepting credit risk. The two indices reflect the expected level of equity and credit market risk.
When the perceived level of risk in the equity market (reflected by the VIX index) declines and the expected level of risk in the credit market (captured by the Credit Suisse Index) does not, it creates a divergence. That divergence now exceeds two standard deviations and has become extreme. When this has happened in the past, the credit market has proved to be correct: equity prices have fallen and volatility has increased - in all periods from one week to one year.
The Data
The table in Figure 1 below documents the subsequent percentage change in the VIX index when the ratio between the Credit Suisse High-Yield Index and the VIX Index exceeded two standard deviations (SD). The data from the table covers the period from 1990 through the present. As you can see from the table, this sequence of events is unusual and has only happened 13 times in the last 25 years.
The mean and median change in the VIX index was positive for every subsequent time period: 1 Week, 2 Weeks, 1 Month, 2 Months, 3 Months, 6 Months, and 1 Year. The subsequent increases in the VIX index were quite large, as high as 44.7%. The results for the one year time period were highly statistically significant (99%).
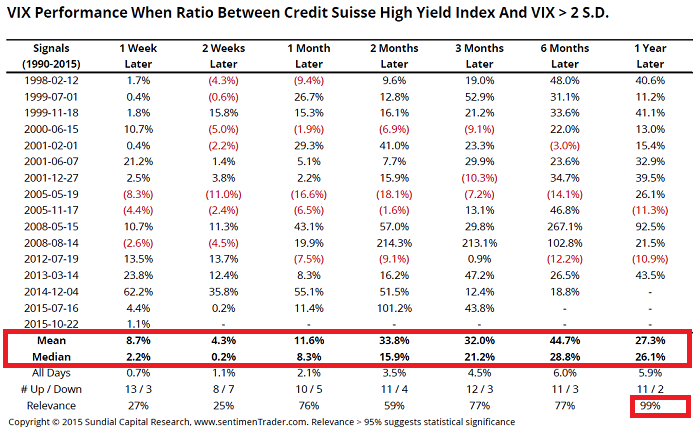
Figure 1: VIX Performance + 2 SD Divergence
The table in Figure 2 below documents the ensuing return of the S&P 500 Index when the ratio between the Credit Suisse High-Yield Index and the VIX Index exceeded two standard deviations (SD). The data from the table covers the period from 1990 through the present.
The mean return of the S&P 500 Index was negative for every subsequent time period: 1 Week, 2 Weeks, 1 Month, 2 Months, 3 Months, 6 Months, and 1 Year. This is highly unusual given the long-term historical bullish bias that has existed in stocks. If you look at the "All Days" return row, you will see that the return for the S&P 500 for all periods is normally positive. The returns for the one week and one year time periods were highly statistically significant (99% and 96% respectively).
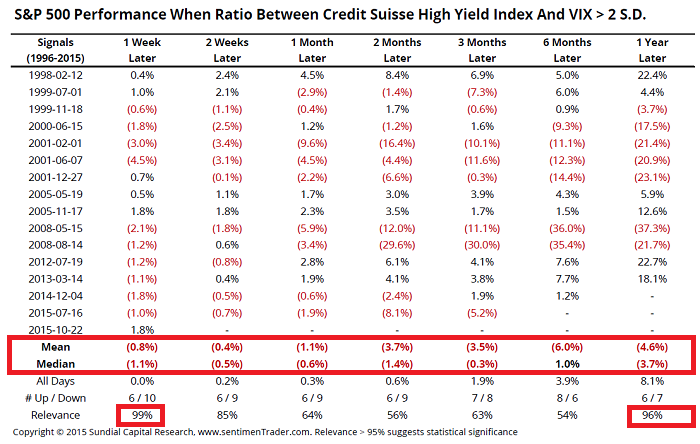
Figure 2: S&P 500 Performance + 2 SD Divergence
Conclusion
As is always the case, we should never assign too much weight to any one indicator. However, the extreme divergence above has been highly predictive in the past. The credit market has historically been much more proficient at identifying downside risk than the equity market. When extreme divergences between the two markets exist, do not bet against the credit market.
Print and Kindle Versions of Brian Johnson's 2nd Book are Available on Amazon (75% 5-Star Reviews)
Print and Kindle Versions of Brian Johnson's 1st Book are Available on Amazon (79% 5-Star Reviews)
Trader Edge Strategy E-Subscription Now Available: 20% ROR
The Trader Edge Asset Allocation Rotational (AAR) Strategy is a conservative, long-only, asset allocation strategy that rotates monthly among five large asset classes. The AAR strategy has generated annual returns of approximately 20% over the combined back and forward test period. Please use the above link to learn more about the AAR strategy.
Brian Johnson
Copyright 2015 - Trading Insights, LLC - All Rights Reserved.


Pingback: Quantocracy's Daily Wrap for 11/01/2015 | Quantocracy
Pingback: IMHO BEST LINKS FROM QUANTOCRACY FOR THE WEEK 26 OCT 15 — 1 NOV 15 | Quantitative Investor Blog