This article presents the Trader Edge aggregate neural network model forecast for the June 2016 non-farm payroll data, which is scheduled to be released tomorrow morning at 8:30 AM EDT.
Non-Farm Payroll (NFP) Model Forecast - June 2016
The Trader Edge aggregate NFP model represents the average of three neural network forecasting models, each of which employs a different neural network architecture. Unlike expert systems, neural networks use algorithms to identify and quantify complex relationships between variables based on historical data. All three models derive their forecasts from seven explanatory variables and the changes in those variables over time.
The table in Figure 1 below includes the monthly non-farm payroll data for two months: May and June 2016. The May data was released last month and the non-farm payroll data for June 2016 will be released tomorrow morning at 8:30 AM EDT.
The model forecasts are in the third data row of the table (in blue). Note that past and current forecasts reflect the latest values of the independent variables, which means that forecasts will change when revisions are made to the historical economic data.
The monthly standard error of the model is approximately 82,400 jobs. The first and last data rows of the table report the forecast plus one standard error (in green) and the forecast minus one standard error (in red), respectively. All values are rounded to the nearest thousand. If the model errors were normally distributed, roughly 16% of the observations would fall below minus one standard error and another 16% of the observations would exceed plus one standard error.
The actual non-farm payroll release for May is in the second data row of the table (in purple). The consensus estimate (reported by Briefing.com) for June 2016 is also in the second data row of the table (in purple). The reported and consensus NFP values also include the deviation from the forecast NFP (as a multiple of the standard error of the estimate). Finally, the last column of the table includes the estimated changes from May to June 2016.
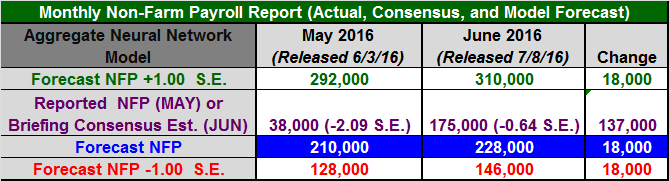
Figure 1: Non-Farm Payroll Table June 2016
Model Commentary
The aggregate neural network model forecast for June is 228,000, which is up 18,000 jobs from last month's revised forecast of 210,000, reflecting a slight strengthening in the employment environment during the month of June. The Briefing.com consensus estimate for June is 175,000, which is up a staggering 137,000 jobs from the May NFP data (38,000), suggesting a remarkable strengthening in the employment environment.
What is really happening is that the actual May data was an extreme outlier: over 2 standard errors (-2.09) below the forecast data. The consensus estimate for June is also significantly below the June model forecast (-0.64 S.E.). The fact that the actual data for May and the consensus estimate for June were both significantly below their respective forecasts increases the probability of a material upside surprise tomorrow. In other words, there is an increased probability that the actual June NFP data will exceed the consensus estimate by a significant amount.
This is particularly important, because a large upside surprise tomorrow could resurrect the possibility of a Fed rate hike, which the market had completely discounted after last month's NFP report and the volatility induced by Brexit.
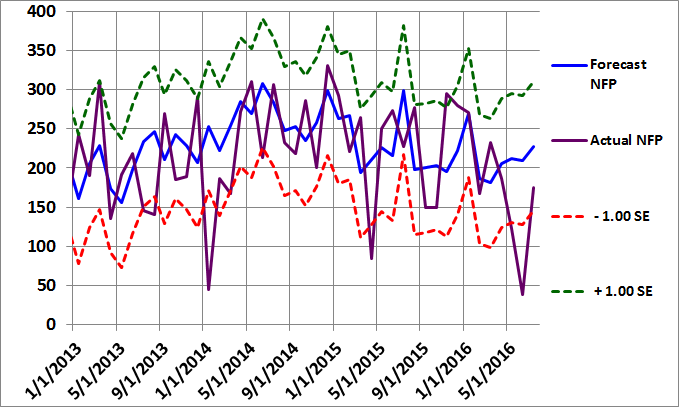
Figure 2: Non-Farm Payroll Graph June 2016
I added a new chart recently (Figure 3 below) to make it easier to observe trends in the employment environment. The blue line depicts the model forecasts (including the latest revisions) and is exactly the same as the Forecast NFP line in Figure 2 above. However, Figure 3 also contains a purple line, which shows the 12-month moving average of the NFP model forecasts.
Why plot the moving average of the model forecasts instead of the actual NFP data? Because the actual NFP data is notoriously noisy. The Forecast NFP data more accurately captures the strength of the employment environment and the stability of the data series makes it easier to observe the trend in employment.
We can use the chart below in Figure 3 in two ways to identify the trend in employment. First, we can observe the forecast NFP data relative to the moving average. Observations below the moving average indicate a weakening in employment and vice versa. Second, we can observe the slope of the moving average line. When the moving average line is downward-sloping, employment is weakening and vice versa.
As you can see from the chart in Figure 3, the slope had been negative since early 2015, briefly leveled out, but is still declining. However, the most recent forecast is slightly above the 12-month moving average, but this is only one data point. Unfortunately, 16 of the previous 18 forecast observations were below the moving average line. The employment environment had clearly been weakening for some time, but there is the possibility that it is beginning to stabilize.
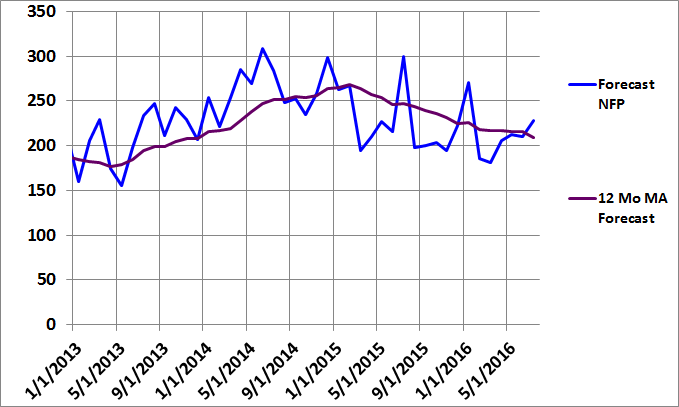
Figure 3: NFP Forecast MA Graph June 2016
Due to the notorious noise in the NFP data, I do not typically include the chart with the moving average of the actual NFP data (Figure 4 below). However, given the large, recent, negative outliers, the actual NFP data appears much worse than the forecast data. I have a lot more confidence in the accuracy of the forecast data, but I wanted to include the actual data this month to paint a complete picture of the employment environment.
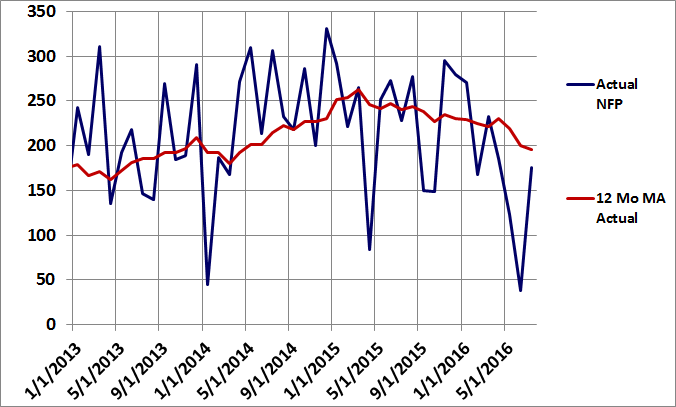
Figure 4: NFP Actual MA Graph June 2016
Summary
The model forecasts for May and June suggest there is an increased probability that the actual June NFP data will exceed the consensus estimate by a material amount tomorrow. This could resurrect the possibility of a Fed rate hike, which had been heavily discounted by the market due to recent events.
According to the latest CME Group FedWatch probability calculation, the implied probability of a Fed rate hike is effectively 0% in July and only 5.9% at the September or November meetings.
As a result, a large upside NFP surprise tomorrow could have significant implications for equity, bond, commodity, and currency markets.
Basic forecasting tools can help you identify unusual consensus economic estimates, which often lead to substantial surprises and market movements. Identifying such environments in advance may help you protect your portfolio from these corrections and help you determine the optimal entry and exit points for your strategies.
In the case of the NFP data, the monthly report data is highly variable and prone to substantial revisions. As a result, having an independent and unbiased indicator of the health of the U.S. job market is especially important.
Print and Kindle Versions of Brian Johnson's 2nd Book are Available on Amazon (75% 5-Star Reviews)
Exploiting Earnings Volatility: An Innovative New Approach to Evaluating, Optimizing, and Trading Option Strategies to Profit from Earnings Announcements.
Print and Kindle Versions of Brian Johnson's 1st Book are Available on Amazon (79% 5-Star Reviews)
Option Strategy Risk / Return Ratios: A Revolutionary New Approach to Optimizing, Adjusting, and Trading Any Option Income Strategy
Brian Johnson


Non-Farm Payroll (NFP) Model Forecast – June 2016
This article presents the Trader Edge aggregate neural network model forecast for the June 2016 non-farm payroll data, which is scheduled to be released tomorrow morning at 8:30 AM EDT.
Non-Farm Payroll (NFP) Model Forecast - June 2016
The Trader Edge aggregate NFP model represents the average of three neural network forecasting models, each of which employs a different neural network architecture. Unlike expert systems, neural networks use algorithms to identify and quantify complex relationships between variables based on historical data. All three models derive their forecasts from seven explanatory variables and the changes in those variables over time.
The table in Figure 1 below includes the monthly non-farm payroll data for two months: May and June 2016. The May data was released last month and the non-farm payroll data for June 2016 will be released tomorrow morning at 8:30 AM EDT.
The model forecasts are in the third data row of the table (in blue). Note that past and current forecasts reflect the latest values of the independent variables, which means that forecasts will change when revisions are made to the historical economic data.
The monthly standard error of the model is approximately 82,400 jobs. The first and last data rows of the table report the forecast plus one standard error (in green) and the forecast minus one standard error (in red), respectively. All values are rounded to the nearest thousand. If the model errors were normally distributed, roughly 16% of the observations would fall below minus one standard error and another 16% of the observations would exceed plus one standard error.
The actual non-farm payroll release for May is in the second data row of the table (in purple). The consensus estimate (reported by Briefing.com) for June 2016 is also in the second data row of the table (in purple). The reported and consensus NFP values also include the deviation from the forecast NFP (as a multiple of the standard error of the estimate). Finally, the last column of the table includes the estimated changes from May to June 2016.
Figure 1: Non-Farm Payroll Table June 2016
Model Commentary
The aggregate neural network model forecast for June is 228,000, which is up 18,000 jobs from last month's revised forecast of 210,000, reflecting a slight strengthening in the employment environment during the month of June. The Briefing.com consensus estimate for June is 175,000, which is up a staggering 137,000 jobs from the May NFP data (38,000), suggesting a remarkable strengthening in the employment environment.
What is really happening is that the actual May data was an extreme outlier: over 2 standard errors (-2.09) below the forecast data. The consensus estimate for June is also significantly below the June model forecast (-0.64 S.E.). The fact that the actual data for May and the consensus estimate for June were both significantly below their respective forecasts increases the probability of a material upside surprise tomorrow. In other words, there is an increased probability that the actual June NFP data will exceed the consensus estimate by a significant amount.
This is particularly important, because a large upside surprise tomorrow could resurrect the possibility of a Fed rate hike, which the market had completely discounted after last month's NFP report and the volatility induced by Brexit.
Figure 2: Non-Farm Payroll Graph June 2016
I added a new chart recently (Figure 3 below) to make it easier to observe trends in the employment environment. The blue line depicts the model forecasts (including the latest revisions) and is exactly the same as the Forecast NFP line in Figure 2 above. However, Figure 3 also contains a purple line, which shows the 12-month moving average of the NFP model forecasts.
Why plot the moving average of the model forecasts instead of the actual NFP data? Because the actual NFP data is notoriously noisy. The Forecast NFP data more accurately captures the strength of the employment environment and the stability of the data series makes it easier to observe the trend in employment.
We can use the chart below in Figure 3 in two ways to identify the trend in employment. First, we can observe the forecast NFP data relative to the moving average. Observations below the moving average indicate a weakening in employment and vice versa. Second, we can observe the slope of the moving average line. When the moving average line is downward-sloping, employment is weakening and vice versa.
As you can see from the chart in Figure 3, the slope had been negative since early 2015, briefly leveled out, but is still declining. However, the most recent forecast is slightly above the 12-month moving average, but this is only one data point. Unfortunately, 16 of the previous 18 forecast observations were below the moving average line. The employment environment had clearly been weakening for some time, but there is the possibility that it is beginning to stabilize.
Figure 3: NFP Forecast MA Graph June 2016
Due to the notorious noise in the NFP data, I do not typically include the chart with the moving average of the actual NFP data (Figure 4 below). However, given the large, recent, negative outliers, the actual NFP data appears much worse than the forecast data. I have a lot more confidence in the accuracy of the forecast data, but I wanted to include the actual data this month to paint a complete picture of the employment environment.
Figure 4: NFP Actual MA Graph June 2016
Summary
The model forecasts for May and June suggest there is an increased probability that the actual June NFP data will exceed the consensus estimate by a material amount tomorrow. This could resurrect the possibility of a Fed rate hike, which had been heavily discounted by the market due to recent events.
According to the latest CME Group FedWatch probability calculation, the implied probability of a Fed rate hike is effectively 0% in July and only 5.9% at the September or November meetings.
As a result, a large upside NFP surprise tomorrow could have significant implications for equity, bond, commodity, and currency markets.
Basic forecasting tools can help you identify unusual consensus economic estimates, which often lead to substantial surprises and market movements. Identifying such environments in advance may help you protect your portfolio from these corrections and help you determine the optimal entry and exit points for your strategies.
In the case of the NFP data, the monthly report data is highly variable and prone to substantial revisions. As a result, having an independent and unbiased indicator of the health of the U.S. job market is especially important.
Print and Kindle Versions of Brian Johnson's 2nd Book are Available on Amazon (75% 5-Star Reviews)
Exploiting Earnings Volatility: An Innovative New Approach to Evaluating, Optimizing, and Trading Option Strategies to Profit from Earnings Announcements.
Print and Kindle Versions of Brian Johnson's 1st Book are Available on Amazon (79% 5-Star Reviews)
Option Strategy Risk / Return Ratios: A Revolutionary New Approach to Optimizing, Adjusting, and Trading Any Option Income Strategy
Brian Johnson
About Brian Johnson
I have been an investment professional for over 30 years. I worked as a fixed income portfolio manager, personally managing over $13 billion in assets for institutional clients. I was also the President of a financial consulting and software development firm, developing artificial intelligence based forecasting and risk management systems for institutional investment managers. I am now a full-time proprietary trader in options, futures, stocks, and ETFs using both algorithmic and discretionary trading strategies. In addition to my professional investment experience, I designed and taught courses in financial derivatives for both MBA and undergraduate business programs on a part-time basis for a number of years. I have also written four books on options and derivative strategies.