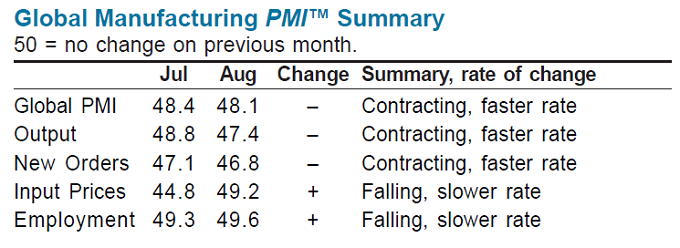
The trading rules series will continue shortly, but I wanted to comment briefly on a recent economic report. JP Morgan's Global Manufacturing PMI contracted at a faster rate in August, decreasing from 48.4 to 48.1. The August PMI value was the lowest in the last 38 months.
JP Morgan Global Manufacturing PMI
JP Morgan and Markit developed a composite index called the JP Morgan Global Manufacturing PMI, which I also discussed last month. The JP Morgan Global Manufacturing PMI index is a GDP weighted composite of each country's latest monthly PMI value. PMI values below 50 signify contraction and PMI values above 50 indicate expansion. According to Markit Economics, a leading specialist in business surveys and economic indices,
"The PMIs have become the most closely-watched business surveys in the world, favored by central banks, financial markets and business decision makers for their ability to provide up-to-date, accurate and often unique monthly indicators of economic trends."
The August Global PMI reading of 48.1 was the lowest reported index value since June 2009. In addition, August marked the third consecutive month of contraction. In addition to calculating the Global PMI, separate index values are calculated for output and new orders. New orders offer possible insights into the direction of the Global Manufacturing PMI in the future.
Not only were the Global PMI, output, and new order indices all below 50.0, but they are all continuing to contract at a faster rate. In other words, not only is the trend already negative, but the rate of decline is still increasing (Figure 1 below). In addition, the August index for new orders was substantially lower than the Global PMI, which is particularly troubling.
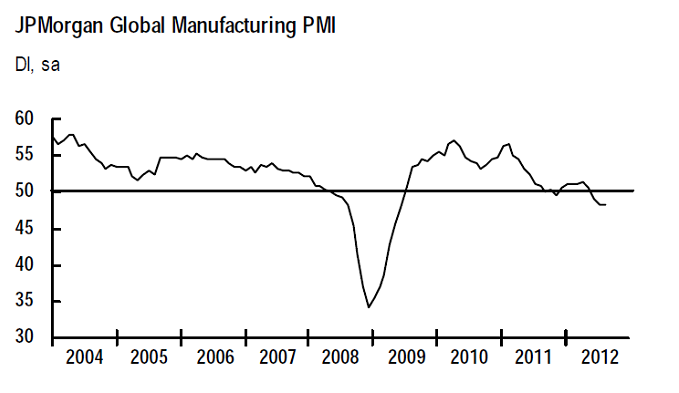
The easiest way to recognize the disturbing trend in the JP Morgan Global Manufacturing PMI is to plot the index values over time. The chart in Figure 2 below represents a nine-year history of the Global Manufacturing PMI. If you are a chart reader, the trend will be obvious. There is a clear pattern of lower highs and lower lows. The definitive and sustained penetration of the contraction line is also obvious in the chart.
Conclusion
The PMI series is one of the best and most respected leading indicators and the Global PMI provides a comprehensive picture of the health and direction of the global economy. The Global PMI continues to point to a worldwide recession.
Nevertheless, equity prices continue to surge higher, fueled by the non-economic asset purchases of central banks across the globe. The ECB recently unveiled its plan to make essentially unlimited sovereign debt purchases of potentially insolvent countries.
In addition, the unexpectedly weak US non-farm payroll report prompted helicopter Ben Bernanke to announce a new open-ended version of QE3, pledging to buy an additional $40 billion in mortgage-backed securities (MBS) a month for as long as necessary. Finally, the Bank of Japan just announced its own 10 trillion yen (about $125 billion) asset purchase program.
The equity market is clearly overbought and a correction is long overdue. However, as I mentioned in an earlier post, Never Short a Bull Market, especially when faced with coordinated, worldwide central bank intervention.
Weak fundamentals may eventually trump monetary stimulus, but it is always advisable to wait for confirmation of a trend change before establishing short positions.
Feedback
Your comments, feedback, and questions are always welcome and appreciated. Please use the comment section at the bottom of this page or send me an email.
Do you have any questions about the material? What topics would you like to see in the future?
Referrals
If you found the information on www.TraderEdge.Net helpful, please pass along the link to your friends and colleagues or share the link with your social network.
The "Share / Save" button below contains links to all major social networks. If you do not see your social network listed, use the down-arrow to access the entire list of social networking sites.
Thank you for your support.
Brian Johnson
Copyright 2012 - Trading Insights, LLC - All Rights Reserved.
.


Pingback: ECRI Betrayed by Their Own Index | Trader Edge