The first and most important rule of trading is to always trade with the prevailing trend. I have emphasized this rule in a number of my past posts. It holds true in all market environments, but is especially crucial in bull markets, which can stay overbought for extended periods. As John Maynard Keynes noted "The market can stay irrational longer than you can stay solvent."
I continue to believe that the odds favor a recession in the U.S. and the market is overdue for a correction. Even if those projections are accurate, it does not mean that the market will reverse direction in the immediate future. It is notoriously difficult to forecast the beginning of a recession and even more difficult to forecast cyclical market tops. The fact is that the S&P 500 is still in an uptrend and it is unwise to short a bull market. It is much more prudent to wait for the trend to change than to stand in front of a speeding freight train.
S&P 500 Uptrend
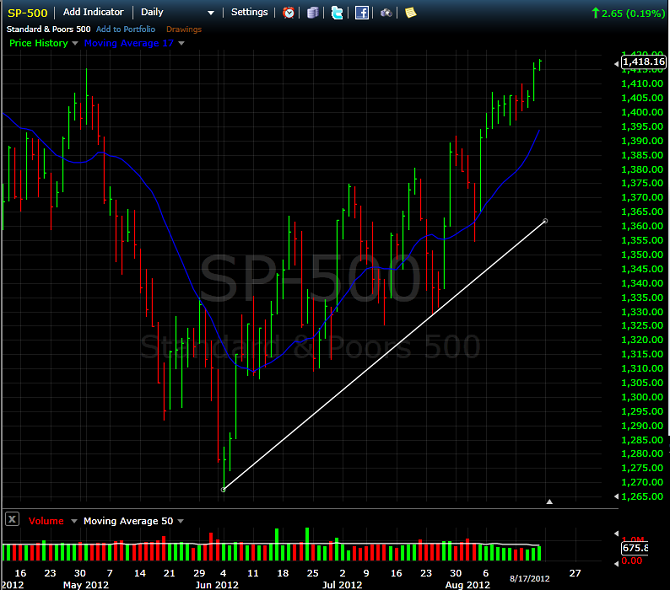
There are many ways to determine trend direction. One of the most common is a simple trend line, which I discussed in the recent post titled How to Draw Trendlines & Avoid Severe Losses. Moving averages are also useful for this purpose. Figure 1 below is a daily candlestick chart of the S&P 500 index as of August 17, 2012.
The screen shot is from www.FreeStockCharts.com, an excellent (and obviously free) resource for traders. I drew a support line from the low on 6/4/2012 and also included a 17-day simple moving average. As you can see from the chart, there is no question that the market is still in an uptrend. The S&P 500 is consistently making higher highs and higher lows and is well above both the support line and the simple moving average.
Fundamental vs. Technical Tools
My summary market indicator score combines the bullish or bearish readings from 34 separate data series. The indicator score has three main components: technical, breadth and relative strength, and economic indicators that tend to lead the market. All indicators are on a scale of -100 (max bearish) to +100 (max bullish).
As I mentioned in earlier posts, the overall summary market indicator score has been close to zero. The breadth and relative strength components have been positive, but have been offset by a negative reading for the economic indicators component. This created a divergence between price and economic fundamentals. I expected price to correct, but that has not happened.
Instead, the breadth and relative strength scores have continued to increase and the economic fundamentals have even improved slightly. However, the fundamental economic picture is still troubling. The JP Morgan Global Manufacturing PMI, one of the most accurate leading economic indicators, reveals we are already in a global contraction and the rate of contraction is accelerating. In addition, according to a recent FactSet report, the projected year-over-year earnings growth for the third quarter of 2012 is actually negative.
Despite negative fundamental factors and numerous sources of exogenous event risk, equity prices have continued to climb. This illustrates another trading tenet: fundamental analysis tells us what to buy, but technical analysis tells us when to buy.
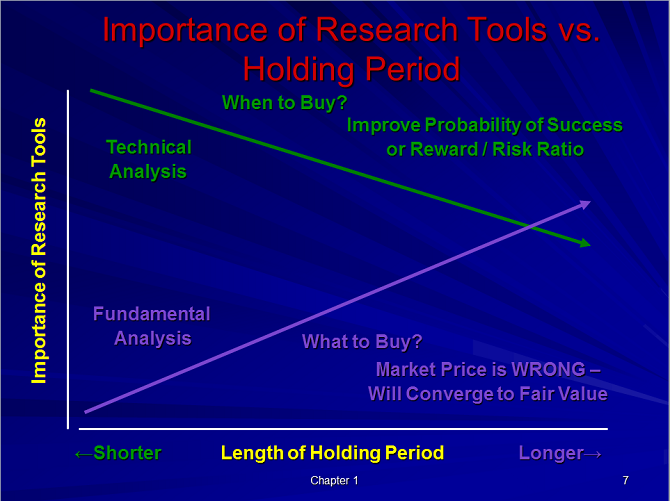
I used the following chart in teaching my undergraduate and MBA level Financial Derivatives courses (see Figure 2 below). The horizontal or X-axis reflects the length of the investment horizon or holding period. The vertical or Y-axis depicts the relative importance of technical and fundamental analysis.
Fundamental analysis assumes an analyst or investor can accurately determine the correct value for a security or market index. This also implies that the market price is incorrect. For fundamental analysis to be successful, the price must converge toward the analyst's estimated value over time.
Even if we accept that premise, the odds of the market suddenly realizing that the market price of the security is wrong and the price converging to the analyst's estimate of fair value in the next five minutes are infinitesimal. As a result, for very short-term holding periods (day trading for example), fundamental analysis is essentially worthless. Conversely, technical analysis is our only valid resource.
As we increase the length of the holding period to several weeks or even a month, technical analysis still dominates, but fundamental analysis becomes increasingly important. As a result, it would not be prudent to let fundamental factors dominate our investment process for intermediate-term decisions. If our fundamental view were correct, but we consistently get stopped out because of poorly timed technical entries, we would still lose money.
For long-term cyclical investment decisions, both technical and fundamental analysis are important and both should be part of our investment process. Regardless of our investment horizon, we should always trade in the direction of the prevailing trend.
Conclusion
The equity markets are clearly in an uptrend. If you have a bearish outlook, it would be prudent to wait for a trend reversal before establishing short positions. If you do choose to establish counter-trend positions in a bull market, you might consider selling out-of-the-money credit spreads (bear call spreads) one or more standard deviations above the current market price.
The disadvantage of this strategy is that implied volatility is typically low and options are inexpensive in a sustained bull market. However, the advantage of this strategy is the positive time decay. You would make money even if the market stays the same or even increases modestly. This type of strategy can offer high probability trades in confirmed overbought environments. As always, stops should be used to ensure a reasonable risk-return tradeoff.
If you would like to learn more about credit spreads, you might be interested in my article titled "The Science of Selling Options" in the September issue of Active Trader
Feedback
Your comments, feedback, and questions are always welcome and appreciated. Please use the comment section at the bottom of this page or send me an email.
Do you have any questions about the material? What topics would you like to see in the future?
Referrals
If you found the information on www.TraderEdge.Net helpful, please pass along the link to your friends and colleagues or share the link with your social network.
The "Share / Save" button below contains links to all major social networks. If you do not see your social network listed, use the down-arrow to access the entire list of social networking sites.
Thank you for your support.
Brian Johnson
Copyright 2012 - Trading Insights, LLC - All Rights Reserved.
.


Pingback: Global Manufacturing PMI Deteriorates Further | Trader Edge