Sometimes the simplest ideas work the best. Before market peaks, shares typically transition from strong (institutional) hands to weak (retail) hands. Before market troughs, shares usually move from weak hands back into strong hands. Both of these scenarios result in increased trading volume.
Given this premise, I created a simple indicator based on the ratio of price to average volume. In this article, I will demonstrate how to use this Price-Volume (PV) indicator to identify potential reversals in broad market ETFs. I also provide the AMIBroker code for this indicator at the end of the article.
PV Ratio Indicator
If volume increases after sustained advances as the market approaches a peak, then the price/volume ratio should decline, even while prices continue to climb. This should provide advance warning of market tops. Conversely, increased volume during price declines will cause the price/volume ratio to initially fall faster than price. However, after shares have moved to stronger hands and volume begins to decline, the price/volume ratio will begin to climb, even as prices consolidate.
This sounds good in practice, but the daily volatility can fluctuate wildly. As a result, when calculating the PV ratio, I divide price by a short-term moving average of volume - to smooth out the PV indicator values.
PV Ratio = Closing price / MA(Volume, MA Periods)
To identify potential trend changes, it is also useful to compare the PV ratio to a moving average of the PV Ratio.
PV Ratio Example
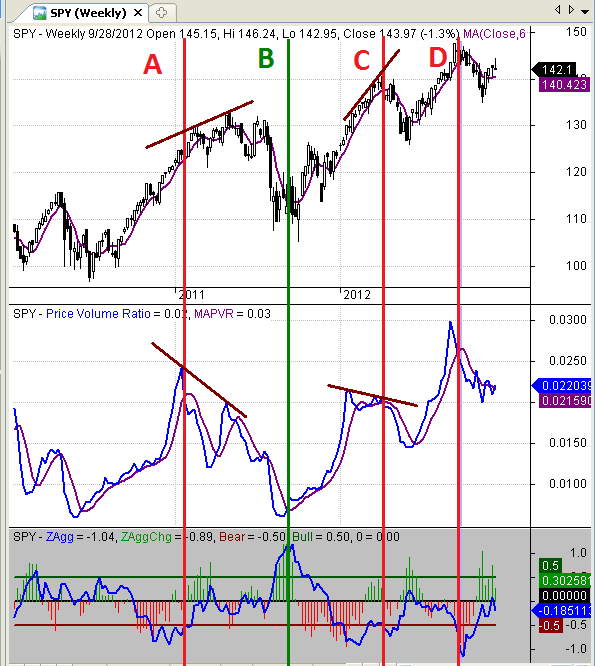
The top panel in Figure 1 below is a weekly candlestick chart of the SPY ETF. The second panel illustrates the PV ratio (blue line) and a six-week moving average of the PV ratio (purple line). The bottom panel includes one of my favorite tools: a custom commitment of traders (COT) indicator. There is obviously no COT data for ETFs; as a result, the COT indicator represents the weighted COT results for all equity futures contracts. The horizontal green and red lines in this panel represent extreme bullish and bearish equity market thresholds, respectively.
Point A occurred in early 2011. Prices had been rising for months and the bull market appeared invincible. At that time, the PV ratio dropped sharply, crossing its moving average. The PV ratio continued to decline, rose slightly, then declined below its moving average again. During this time, prices continued to make higher highs. This set up a classic divergence: SPY prices making higher highs and the PV indicator making lower highs. In addition, at Point A the commercial positions were beyond the bearish extreme, setting up a very high probability bearish reversal. Please note that when using the PV indicator, signals can be early, especially for bearish reversals.
Point B occurred in mid-September 2011. Prices had fallen sharply for two months and had begun to consolidate. Volume declined, forcing the PV ratio to increase above its moving average. The commercial positions were extremely bullish, well beyond the bullish extreme threshold, confirming the bullish reversal trade.
Point C was very similar to Point A: extended rally, PV ratio crossing below moving average, PV ratio negative divergence, and extremely bearish COT indicator. This time price reversed almost immediately.
Point D did not have the benefit of a bearish divergence, but the bearish reversal was confirmed by both the PV ratio and by the extremely bearish COT reading.
Practical Considerations
The above chart illustrates how to use the PV indicator to identify several of the high probability reversals in the SPY over the past two years. I used a weekly time-frame for this chart to eliminate the noise in the daily chart. If you use this approach on a daily chart, you will probably need to increase the length of the moving averages to dampen some of the volatility in the daily data.
I have also found that this indicator works better for ETFs that replicate broad market indices. Volume on individual stocks, sector ETFs, and futures contracts can be driven by different factors than professional-retail accumulation and distribution, which compromises the effectiveness of the PV indicator readings.
PV Ratio - AmiBroker Code
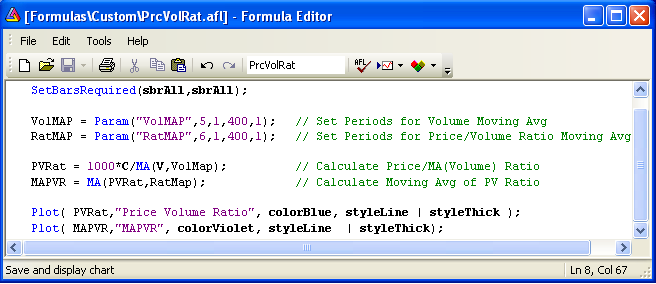
The image below is a screenshot of the PV Ratio indicator from my AmiBroker platform. If you would like to use the indicator, you would need to type the code into AmiBroker and save the formula. The code compiles and runs without error on my AmiBroker platform.
As always, the above post and code sample were provided for educational purposes only and should not be construed as investment advice or used for trading purposes. I have not back-tested the above code and do not make any representations regarding its performance.
Conclusion
The PV ratio indicator is a simple way to identify prospective reversals in broad market equity ETFs. It is a simple approach that capitalizes on the tendency of volume to increase at market peaks and troughs. As is always the case, the indicator should be used in isolation. Ideally, it would be used in conjunction with other indicators that are not based on price or volume (such as the COT indicator).
Feedback
Your comments, feedback, and questions are always welcome and appreciated. Please use the comment section at the bottom of this page or send me an email.
Do you have any questions about the material? What topics would you like to see in the future?
Referrals
If you found the information on www.TraderEdge.Net helpful, please pass along the link to your friends and colleagues or share the link with your social or professional networks.
The "Share / Save" button below contains links to all major social and professional networks. If you do not see your network listed, use the down-arrow to access the entire list of networking sites.
Thank you for your support.
Brian Johnson
Copyright 2012 - Trading Insights, LLC - All Rights Reserved.


Excellent presentation. immensely benefited. thks
Rajasekhar,
I am glad that you found the article to be beneficial.
Thanks,
Brian Johnson
Thanks for the very informative article. I use Metastock software and i tried to convert the amibroker code to Metastock code.
This is what i wrote:
X:=1000*(C/Mov(V,5,S));
X;
Mov(X,6,S);
I am using weekly data and even then I am not getting it right. Can you please help me?
Thanks,
George
George,
I have never used Metastock, so I will not be able to offer much help – but I will give it a shot.
The first line looks correct, where you calculate the Price/Volume ratio. It is not clear what the second line X; accomplishes. I would also assume the third line should assign the moving average of X (the price volume ratio) to a new variable, something like the following MAPVR = Mov(X,6,S);
Finally, the example from the article used weekly periods, which means the volume used in the calculation should be weekly as well. I do not know how Metastock handles volume on weekly charts, but this could be another source of a discrepancy.
Sorry I could not be of more help, but I do not use Metastock. Perhaps if another Metastock user reads this post, they could provide some suggestions – or you could ask for help on a Metastock forum.
Best regards,
Brian Johnson