I read about this indicator in an article titled "The Chartmill Value Indicator," which appeared in the January 2013 issue of Technical Analysis of Stocks and Commodities. The article was written by Dirk Vandycke. In the article, Vandycke introduced an interesting oscillator called the Chartmill Value Indicator (CVI). The following article explains the CVI formulas, proposes a modified version of the CVI (MCVI), and demonstrates the potential of the MCVI with a sample pullback strategy. AMIBroker code for the MCVI is included at the end of the article.
The Modified Chartmill Value Indicator (MCVI)
The CVI represents a standardized deviation from a moving average, which can be applied to any price series over any period. The concept is simple. As prices rise, they will eventually rise above a moving average. Eventually, the moving average will begin to rise as well. At this point, prices need to continue to rise to increase the spread between the current price and the underlying moving average. When prices begin to level off or consolidate, the spread will begin to decline as the moving average continues to rise.
This behavior makes it very difficult for the deviation from a moving average to remain in the overbought or oversold regions for extended periods, which represents a significant improvement over other oscillators such as the RSI and Stochastic indicators.
However, a simple price spread from a moving average would not be comparable across all securities, which would preclude us from using the spread in systematic strategies. Fortunately, Vandycke addresses this problem by dividing the spread by the average true range, which is dependent on both the price level and volatility of the underlying security. Here are Vandycke's formulas from the article (with slight changes in notation):
- n = user specified number of periods
- Value Consensus (VC) = MA((H+L)/2, n)
- True High (TH) = Max(H, Ref(C,-1))
- True Low (TL) = Min(L, Ref(C,-1))
- True Range (TR) = TH - TL
- Average True Range (ATR) = MA(TR, n)
- CVI = (C - VC) / ATR
I like this type of indicator and have used similar versions in my algorithmic strategies and in my discretionary trading. However, I feel that the CVI formulas require one important change. Values for the original version of the CVI are not directly comparable across different time periods (n). In other words, it is much easier to achieve large positive or negative values for CVI (large deviations from the moving average), when the number of periods (n) is large.
From option pricing theory, we know that the magnitude of price changes is a function of time, but the relationship is not linear. Instead, price changes are proportional to the square root of time. If we assume that ATR (in the denominator of the CVI formula) is a proxy for volatility, then we can normalize the influence of time on CVI by multiplying ATR by the square root of the number of periods (n ^ 0.5). This adjustment is not perfect, because the moving average moves through time as well, but it is better than not adjusting volatility for time at all. Below is the revised formula for the modified Chartmill Value Indicator:
Modified Chartmill Value Indicator (MCVI) = (C - VC) / (ATR * (n ^ 0.5))
A Sample MCVI Reversal Strategy
When I evaluate a new indicator, I typically use AMIBroker to build a simple test strategy to better understand how the indicator works and how it could be used to add value. Since the MCVI is an oscillator, I created a weekly reversal strategy to buy when conditions were oversold and sell when the market was overbought.
These types of reversal strategies can be profitable, but the key is to only take trades in the same direction as the long-term trend. For the sample strategy below, I used a simple moving average filter, only taking long trades when the closing price was above the long-term moving average and only taking short trades when the closing price was below the moving average.
I optimized the strategy based on weekly values of the S&P 500 Index, the Russell 2000 index, and the NASDAQ 100 index from January 2000 to January 2013. Only one trade was permitted at a time and each trade represented 100% of portfolio equity. No stops were used. The purpose of this exercise was a proof-of-concept only. As a result, I did not withhold an out-of-sample data set. While the example below was based on weekly periods, the MCVI could be used for daily periods as well.
Optimized Parameters:
- User Specified Look-back period (n): 3 weeks
- Long Entry: Weekly CVI crosses below -0.51
- Short Entry: Weekly CVI crosses above +0.43
- Moving Average Filter Periods: 46 weeks
- Long Exit: After 7 weeks
- Short Exit: After 3 weeks
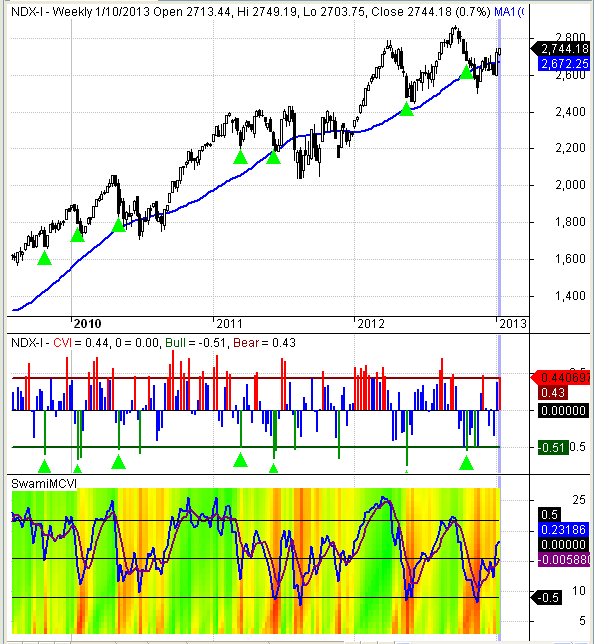
The top panel in Figure 1 below is a weekly candlestick chart of the NASDAQ 100 index (NDX) from late 2009 to January 2013. The blue line signifies the 46 week moving average that was used to filter long and short trades. The middle chart pane uses a histogram to depict the weekly MCVI readings. The bullish and bearish signal thresholds from the optimized strategy are represented by the dark green and dark red horizontal lines, respectively.
The bright green arrows represent prospective signals that met all of the strategy criteria. Note: not all of these trades would have been executed. Remember, only one position was permitted at a time and the strategy was tested on three different indices. In addition, trades remained open for multiple weeks. Nevertheless, the prospective signals should help you understand the types of trades executed by the MCVI reversal strategy.
It is interesting to note that the latest weekly CVI reading (on 1/11/13) for the NDX was above the bearish threshold. However, no strategy signal was warranted due to the moving average filter. Nevertheless, the NDX was overbought.
The third panel illustrates an enhanced SWAMI chart for the MCVI. I have written about SWAMI charts a number of times on this site. Briefly, enhanced SWAMI charts use color gradients to depict indicator values for a wide range of indicator periods on the same chart.
The blue line represents the average CVI value across the entire range of periods. The purple line is a moving average of the blue average SWAMI MCVI line. While I did not use the MCVI enhanced SWAMI indicator in the sample strategy, notice how effectively the extreme enhanced SWAMI levels identified prospective market turning points.
MCVI Strategy Results
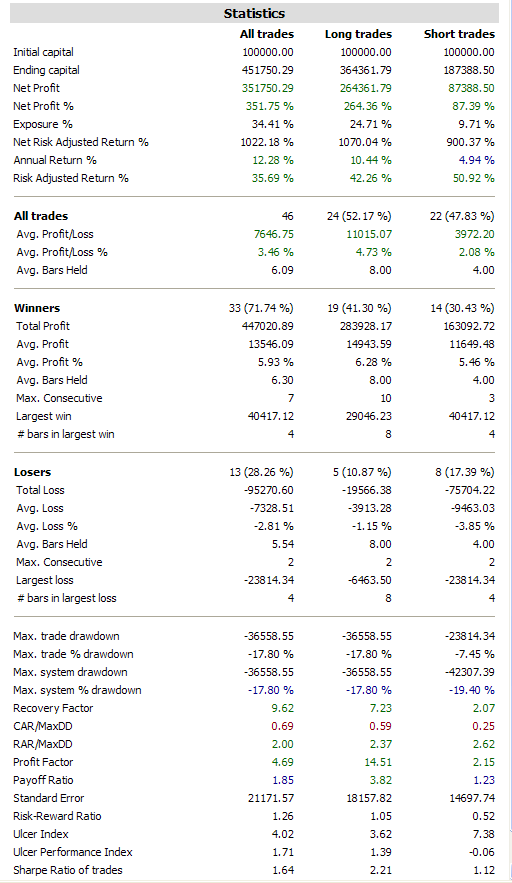
The optimized MCVI strategy earned a compound annual return of 12.28%, but was only invested 34.41% of the time. The resulting risk-adjusted annual return was 35.69%. The maximum peak to trough drawdown was 17.80%, which resulted in a respectable CAR/Maximum Drawdown ratio of 0.69.
71.74% of the trades were profitable and the average profit on winning trades was 5.93% versus an average loss of -2.81% on the losing trades. The corresponding profit factor was 4.69; total gains were 4.69 times total losses. The Sharpe ratio was 1.64. The comprehensive strategy statistics are provided in Figure 2 below.
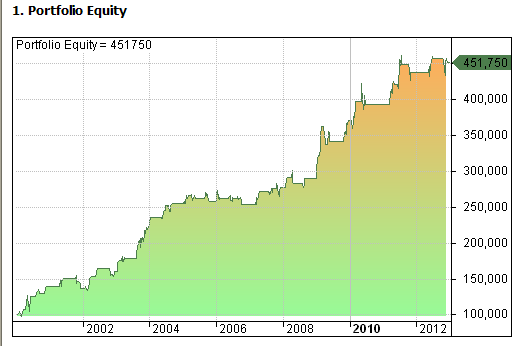
The equity curve is provided in Figures 3 below.
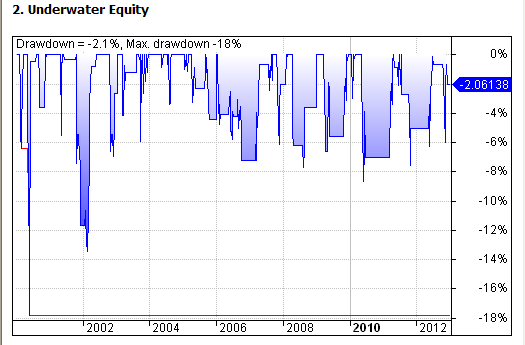
The equity drawdown curve is provided in Figure 4 below. The maximum drawdown was 17.8%, but drawdowns have remained below 10% since 2002.
MCVI AMIBroker Code
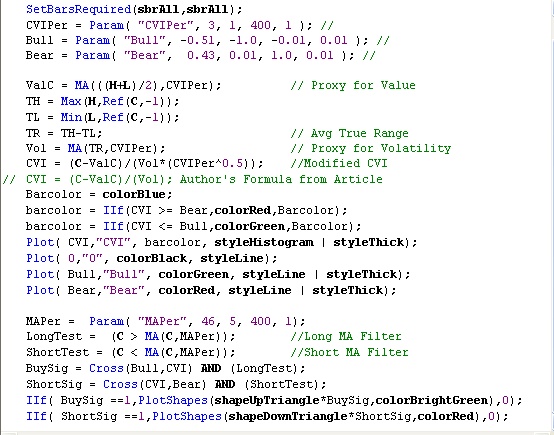
As promised, below is the AMIBroker code for the MCVI. It is a screenshot from my AMIBroker platform, so you would need to retype the code into your AMIBroker platform if you would like to experiment with the MCVI. The MCVI compiles and runs without error on my platform, so if you encounter any errors, they are probably the result of typos.
Note, the code below is for the MCVI, not for the MCVI strategy - although the sample parameters in the code below are the optimized parameters for the strategy.
As always, the sample code and strategy are presented for educational purposes only and are not intended as investment advice. In fact, I do not consider the MCVI sample strategy above to be viable in its current form - due to the lack of stops, which precludes any means of position sizing or risk management.
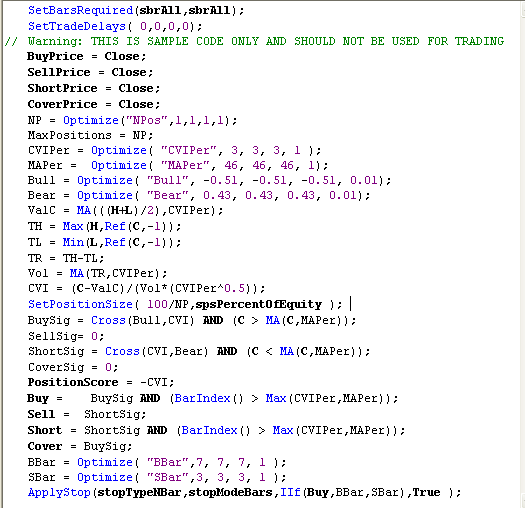
After initially publishing this article, several readers requested a copy of the actual MCVI strategy code (in addition to the indicator code above). If you read the comments below, you will see that I initially attempted to copy and paste the strategy code in my reply, but WordPress corrupted the AMIBroker code. As a result, I am including an image of the actual AMIBroker strategy code in Figure 6 below. The code in the image below is the actual AMIBroker code that generated the results in Figures 2, 3, and 4 above.
Conclusion
The MCVI and enhanced SWAMI MCVI show promise for use in systematic and discretionary strategies. While optimized, the strategy results were impressive, especially for only using a single indicator and a simple moving average filter in the strategy. Ideally, strategies should use several different types of indicators for trade confirmation.
The formula modification to create the MCVI (versus the CVI) is important, without which it would not be practical to generate a SWAMI version of the indicator.
Trader Edge Strategy E-Subscription Now Available: 20% ROR
The Trader Edge Asset Allocation Rotational (AAR) Strategy is a conservative, long-only, asset allocation strategy that rotates monthly among five large asset classes. The AAR strategy has generated 20%+ annual returns over the combined back and forward test period (1/1/1990 to 7/29/2013). Please use the above link to learn more about the AAR strategy.
Feedback
Your comments, feedback, and questions are always welcome and appreciated. Please use the comment section at the bottom of this page or send me an email.
Do you have any questions about the material? What topics would you like to see in the future?
Referrals
If you found the information on www.TraderEdge.Net helpful, please pass along the link to your friends and colleagues or share the link with your social or professional networks.
The "Share / Save" button below contains links to all major social and professional networks. If you do not see your network listed, use the down-arrow to access the entire list of networking sites.
Thank you for your support.
Brian Johnson
Copyright 2013 - Trading Insights, LLC - All Rights Reserved.



I am getting error: No buy/sell assignments. I tried to change BuySig to just buy and ShortSig to sell, then I get no trades. Looking forward to seeing it work as it looks interesting Brian.
Thanks
Milton,
Sorry for the confusion. As I mentioned in the article,
The sample code will generate the MCVI histogram and associated triangles in the second pane of the chart. AMIBroker strategy code has some additional requirements that must be added to the indicator code. You must specify the buy, sell, short, and cover rules (which are the same as buysig and shortsig). In addition, you must specify the maximum number of positions (1), the buy and sell delays (0), the NBar stop periods (provided in the article), and specify a position score.
The sample code can be modified and used as an AMIBroker strategy, but the code only works as a chart indicator in its sample form.
Best regards,
Brian Johnson
I have noticed increased interest in the Modified Chartmill Value Indicator (MCVI) article from one (or more) of the groups at finance.groups.yahoo.com.
If one of the Yahoo finance group members reads this comment, I would be curious which group provided the link to the article on TraderEdge.Net. It would be interesting to learn more about your group.
Thank you,
Brian Johnson
Hi Brian,
Probably just a small question; I don’t understand why it is better to normalize volatility for time if one doesn’t use investment instruments that decay with time like options.
Thanks for sharing your knowledge on your website.
Jeroen
(amateur trader)
Jeroen,
In order to use indicators in discretionary or systematic trading, the indicator values must be comparable across all instruments (stocks, ETFs, futures, etc.), regardless of differences in price and volatility. In addition, indicator values should also be comparable across different look-back periods. This allows us to develop consistent rules that we can use as a foundation for an investment process.
The MCVI measures the deviation of price from a moving average. The deviation is a function of price and the volatility of the underlying instrument.
It would not be unusual for a stock like AAPL, with a current price of 468, to deviate from its moving average by 20 points. However, it would be highly unusual for a stock like JP Morgan (JPM), with a current price of 48, to deviate from its moving average by 20 points. As a result, when calculating the MCVI, we must adjust for the volatility of the underlying instrument.
Just as different instruments have different volatilities, volatility itself is also a function of time. As a result, it would be much more likely for AAPL’s price to deviate by 20 points from its 200-day moving average than from its 10-day moving average. To compensate for this, the MCVI also attempts to “normalize” volatility for time.
This means that an MCVI value of 0.5 for a 10-day look-back period would be approximately comparable to an MCVI value of 0.5 for a 50-day look-back period.
You are correct that there is no time decay for the stocks or ETFs, but the MCVI calculation is based on price and volatility and both are a function of time.
I hope this helps.
Best regards,
Brian Johnson
Yes, that helps! Thanks for taking the time to explain.
Jeroen
Hey Brian, thanks so much for the post…very interesting indicator. The backtest also looks solid. Any chance you would be willing to share the rest of the Ami code? I am sure a few of us fellow Ami users would greatly appreciate it! Thanks for considering!
Aloha
David,
The SAMPLE MCVI strategy code is provided below. As several readers have requested in the past, I copied and pasted the code this time, which may allow you to do the same. However, WordPress could add some additional control characters to the code, which might make this impossible. Please let me know if the copy and paste works. The strategy results from the article are from 1/1/2000 to 1/18/2013 on the RUT, SPX, and NDX indices.
As always, the SAMPLE code is provide for educational purposes only and should NOT be used in actual trading. In addition, the strategy did not include an out of sample period and does not use stops. Please refer to the disclaimer and terms page for additional information.
Best regards,
Brian Johnson
SetBarsRequired(sbrAll,sbrAll);
SetTradeDelays( 0,0,0,0);
// Warning: THIS IS SAMPLE CODE ONLY AND SHOULD NOT BE USED FOR TRADING
BuyPrice = Close;
SellPrice = Close;
ShortPrice = Close;
CoverPrice = Close;
NP = Optimize(“NPos”,1,1,1,1);
MaxPositions = NP;
CVIPer = Optimize( “CVIPer”, 3, 3, 3, 1 );
MAPer = Optimize( “MAPer”, 46, 46, 46, 1);
Bull = Optimize( “Bull”, -0.51, -0.51, -0.51, 0.01);
Bear = Optimize( “Bear”, 0.43, 0.43, 0.43, 0.01);
ValC = MA(((H+L)/2),CVIPer);
TH = Max(H,Ref(C,-1));
TL = Min(L,Ref(C,-1));
TR = TH-TL;
Vol = MA(TR,CVIPer);
CVI = (C-ValC)/(Vol*(CVIPer^0.5));
SetPositionSize( 100/NP,spsPercentOfEquity );
BuySig = Cross(Bull,CVI) AND (C > MA(C,MAPer));
SellSig= 0;
ShortSig = Cross(CVI,Bear) AND (C < MA(C,MAPer)); CoverSig = 0; PositionScore = -CVI; Buy = BuySig AND (BarIndex() > Max(CVIPer,MAPer));
Sell = ShortSig;
Short = ShortSig AND (BarIndex() > Max(CVIPer,MAPer));
Cover = BuySig;
BBar = Optimize( “BBar”,7, 7, 7, 1 );
SBar = Optimize( “SBar”,3, 3, 3, 1 );
ApplyStop(stopTypeNBar,stopModeBars,IIf(Buy,BBar,SBar),True );
Thanks for posting Brian and for the cleanup Milton it is much appreciated. Will play with over the coming weekend!
David,
Good luck with your research. I am glad that Milton was able to correct the WordPress related problems.
Best regards,
Brian Johnson
Well, using Yahoo EOD data on the ^RUT, ^NDC and ^GSPC (S&P500 for yahoo) ended up with much different results. Was trying to match up as close as possible to your backtest to confirm the code was accurate. But, ending up with a ARR of only 3.65% overall with a negative 1.28% on short side.
Pretty dramatic difference, with more losers than winners and a 50% drawdown as well. I assume it is something in the settings or a slight difference in the code from Milton to what you actually used?
Any additional info/ideas appreciated on why this could be so dramatically different. Many thanks.
David,
The difference is due to the ongoing corruption problems when cutting and pasting into WordPress. I compared the code from my last reply to the actual AMIBroker strategy code. WordPress corrupted the file and even deleted one or more lines of code. The code from my last reply was corrupted and IS NOT CORRECT.
I attempted to copy and paste the code again in this reply, but WordPress corrupted the file again. As a result, I am adding an image of the actual AMIBroker strategy code to the original article above. For now, you will have to type the code in by hand, but at least it will be correct.
Once you are using the correct strategy code, the results should be similar. However, I will say that Yahoo EOD data is notoriously inaccurate and unreliable. That is why I switched to CSI.
Finally, the above strategy is weekly, not daily and every exit turns out to be an N-bar exit.
I apologize again for the inconvenience, but this is why I was reluctant to try to copy and paste the code.
Please let me know if the strategy code from the image at the end of the article works correctly.
Best regards,
Brian Johnson
Thanks for “screenshot posting” the code, looks like the stop loss line was causing the error and then switching to weekly got things very close. Yea I do know Yahoo is pretty dicey, but good to know that its lining up very close with yours. Again, really appreciate the followup on this!
Aloha
David,
I would still like to get the “copy and paste” method to work, but the screenshot is 100% reliable – except for reader typos. I am glad that the corrected code delivers comparable results. Good luck with the MCVI.
Best regards,
Brian Johnson
Hi Brian, thanks for posting the code. I had to change all the quotes as wordpress puts in slanted quotes and caused errors (not on quotes but on applystop line which, I couldn’t even delete to get rid of error).
I posted the code the forums originally. The results I get using my basket of ETF’s are not near as good as yours but I will tweak it and see if it can get results as good as you did.
I will also look out for the swami code so I can display that.
Cheers and thanks.
Milton,
Thanks for the update. I was concerned that WordPress would corrupt the code, which is one of the reasons I did not post the code originally. I will continue to experiment with other other copy and paste methods in the future. Hopefully I can find a procedure that will work with WordPress.
Best regards,
Brian Johnson
Thanks for this interesting article.
It will serve me well as I figure out how to code this indicator in C# for NinjaTrader.
I am glad that you found it helpful. I have never used Ninja Trader, but the sample code should be relatively easy to convert.
Best regards,
Brian Johnson
Brian,
Upfront I would like to say thanks for your great article ( Modified Chartmill Value Indicator (MCVI) ) Also, being a long time subscriber to Stocks and Commodities ( traders.com ), I hope and pray you will submit your Chartmill extension article to Stocks and Commodities.
Good Trading
Schippi
Ps :
My free web site is at selectsectors.com
Schippi,
Thanks for your comments. I am glad that you enjoyed the MCVI article.
I have been a long-time subscriber to TASC as well, but have never submitted an article to them – although I have written several articles for Active Trader. Given that the MCVI article has already been published on Trader Edge, I doubt that TASC would consider publishing the piece. I suspect that they only use previously unpublished material.
Thanks again,
Brian Johnson
Pingback: Top 10 Trader Edge Articles | Trader Edge