In previous articles, I explained how to make market timing decisions with relative strength and how to use relative strength to identify market trends. Both of these articles used relative strength to forecast trend changes in the equity market and in the economy. This article explores how to use relative strength to confirm the trend direction of individual securities, regardless of their correlation with the overall market.
Relative Strength Ratios
The most basic relative strength tool is the price ratio. If we were interested in analyzing the continuous crude oil futures contract (CL), we would divide the price of the crude oil contract by the price of the reference asset. We could then evaluate the resulting price ratio using a wide assortment of technical indicators. Since this article deals with trend confirmation, we will apply a simple moving average to the price ratio.
When the price ratio is above its moving average, the price of crude oil is out-performing the reference asset. When the price ratio is below its moving average, the price of crude oil is under-performing the reference asset.
So far so good, but the important question is which reference asset to choose. Arguably the most widely used benchmark is the S&P 500 index. As a result, I used the continuous e-mini S&P 500 (ES) futures contract as the first reference asset.
I also constructed a second price ratio using the continuous U.S. Dollar (DX) futures contract as a reference asset. The dollar tends to move inversely relative to "risk" assets and commodities. As a result, when the dollar is rising, it is very difficult for risk assets and commodities to sustain bullish momentum. A rising dollar (which is in the denominator) puts downward pressure on the second price ratio.
Trend Confirmation
We will use both relative strength price ratios to confirm the trend direction of crude oil futures, requiring that one or both price ratios (your choice) are consistent with the direction of the CL contract. To objectively evaluate the trend direction of the crude oil contract itself, we will use the same simple moving average. When the closing price of crude oil is above its moving average, the trend in crude oil is bullish, and vice versa.
I have just begun experimenting with the above ratios and have not yet had the opportunity to do any formal backtesting. However, only purchasing crude oil when it is rising and out-performing both the S&P 500 and the U.S. dollar should result in higher probability trades - at least in theory. Similarly, only shorting crude oil when it is falling and lagging both the S&P 500 and the U.S. dollar should also improve the performance of bearish trades.
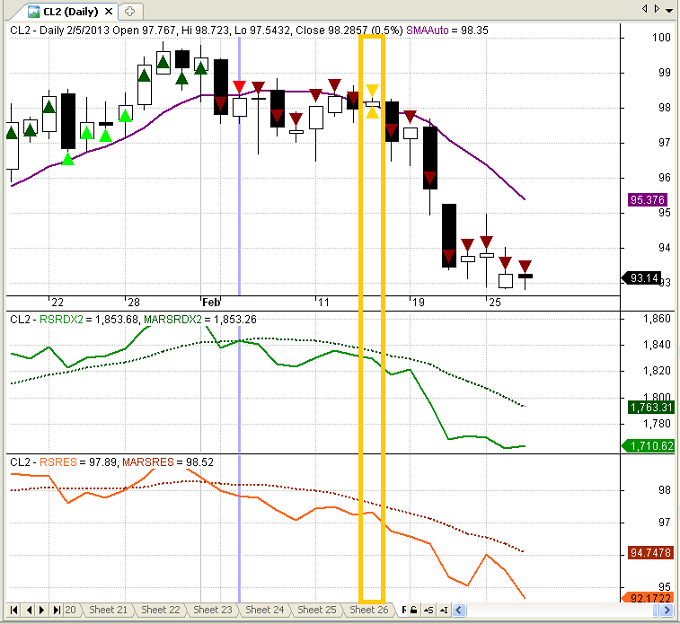
The top panel in Figure 1 below is a daily candlestick chart of the CL futures contract. I used colored triangles to identify the various trend conditions.
- Dark Green and Dark Red Triangles: CL, CL/ES, and CL/DX all above or all below their respective moving averages
- Bright Green and Bright Red Triangles: CL trend direction confirmed by one but not both price ratios
- Gold Triangles: CL trend direction contradicted by both price ratios (CL/ES and CL/DX)
The second panel illustrates the CL/DX price ratio (solid green) and a moving average of the CL/DX price ratio (dashed green). The bottom panel depicts the CL/ES price ratio (solid orange) and a moving average of the CL/ES price ratio (dashed orange).
The current downtrend in crude oil began in early February 2013 with the large down bar. The dark red triangle indicates that the trend reversal was confirmed by both relative strength ratios. CL rose the following day and one of the price ratios reversed direction (bright red triangle), indicating caution. However, the nascent downtrend resumed the next day.
In mid-February the price of crude oil crept above its moving average, but the trend reversal was not confirmed by either of the relative strength price ratios (gold rectangle and gold triangles). Again, caution was warranted (perhaps a tightening of the stops), but both relative strength ratios were still bearish. As you can see, the daily downtrend resumed on the next bar and is still intact - through last night's close.
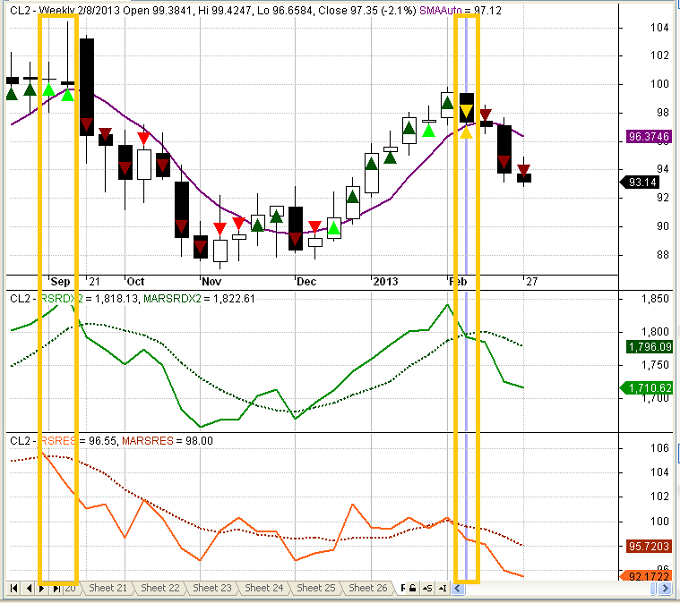
Relative strength price ratios can be used for longer-term trend confirmation as well. The calculations are the same, except that weekly or monthly prices are used. Figure 2 below is a weekly chart of the continuous crude oil contract. All panels and symbols in Figure 2 are the same as those used in Figure 1 above.
In the gold box on the left side of the chart, you will notice two bright green triangles, which occurred at the end of a bullish move in September of 2012. This implied the crude oil uptrend was weakening and was no longer keeping pace with the S&P 500. This suggested caution. Crude oil collapsed the following week and began a two month pullback.
After a period of consolidation (and a few potential whipsaws), crude oil began another bullish move in December. The second gold rectangle at the right side of the chart highlights a gold triangle shape, indicating divergence between the price of crude oil and both relative strength ratios. In this case, the price of crude oil was still above its moving average, but both relative strength ratios had already declined below their respective moving averages. Tightening stops, taking partial profits, or both, would have been warranted.
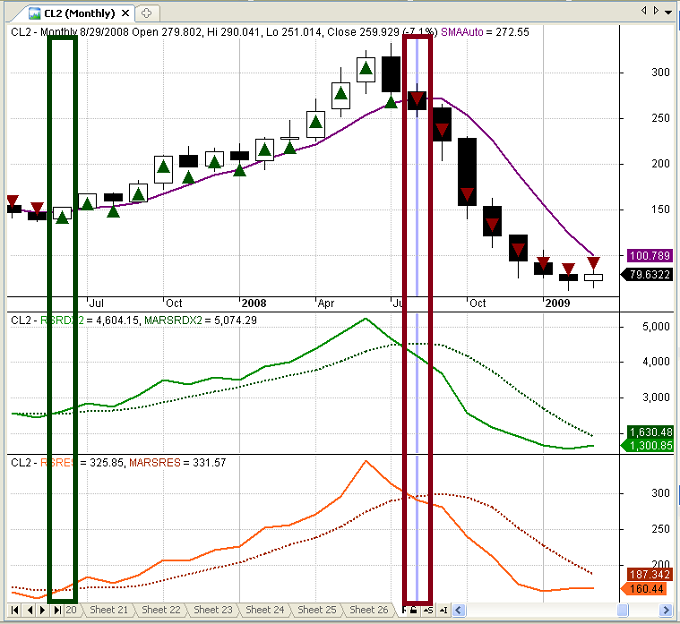
The following graphic in Figure 3 below is a monthly crude oil chart with monthly relative strength ratios. The format is the same as those used above. However, instead of depicting the current environment, I wanted to demonstrate how effective relative strength ratios can be in identifying long-term cyclical movements, such as the one below during the crash of 2008.
At this point, I should point out that the ES ratio described above should not be used for currencies. Currencies are less volatile than the S&P 500 and requiring currencies to out-perform (or under-perform) the S&P 500 is not a reasonable trade criterion.
When I introduce new indicators, I typically try to include sample AMIBroker code. Unfortunately, in this case the length of code makes this impractical. However, the descriptions above should allow you to reproduce the relative strength calculations. Simply calculate the ratio of the closing price of each instrument relative to the S&P 500 and U.S. Dollar futures contracts and compare the resulting ratios to their respective moving averages.
Conclusion
Relative strength ratios are powerful tools that provide insight into the trend direction of individual securities and of the overall market. The above technique offers a new method for confirming trend direction, which could be used to enhance the performance of existing strategies or serve as the foundation for new directional trading systems.
Feedback
Your comments, feedback, and questions are always welcome and appreciated. Please use the comment section at the bottom of this page or send me an email.
Referrals
If you found the information on www.TraderEdge.Net helpful, please pass along the link to your friends and colleagues or share the link with your social network.
The "Share / Save" button below contains links to all major social networks. If you do not see your social network listed, use the down-arrow to access the entire list of social networking sites.
Thank you for your support.
Brian Johnson
Copyright 2013 - Trading Insights, LLC - All Rights Reserved.
.


very good analysis about crude oil , i also trade in crude oil in indian commodity exchange. but you didn’t mention about the how to create second panel illustrates the CL/DX price ratio (solid green) and a moving average of the CL/DX price ratio and the parameter for the MA
with regards
Kumar
Kumar,
The solid green line in the second panel represents the closing price of the continuous crude oil futures contract divided by the closing price of the continuous US dollar futures contract (daily, weekly, or monthly). The dotted line is a moving average of the same price ratio.
I have not backtested these price ratios yet, so the moving average periods are just sample parameters that I used for illustration purposes. I believe I used 6 days, 6 weeks, and 10 months for the respective charts.
These price ratios can be applied to the majority of commodity futures contracts to confirm trend direction.
Best regards,
Brian Johnson
thanks Brian Johnson
Very nice article Brian.
For what it’s worth, the rotational systems that I follow make heavy use of price ratios. One in particular evaluates both of the ratios that you discuss above (or ETF-based variations of them, at least) and requires bullish readings from both (as well as several others) before purchasing oil.
While my entry criteria are marginally more onerous, I thought it was worth mentioning that the system’s limited number of oil trades have panned out well.
Cheers and keep up the great writing!
-Bill
Bill,
Good to hear from you as always. I am a big fan of relative strength analysis and your success with relative strength ratios is encouraging. I use relative strength ratios for market timing, but have not used them extensively for security selection purposes. I plan to test several of these ratios with my existing systematic strategies.
If you would be willing to share the information, do you have any other specific price ratios that would warrant further research?
Thanks,
Brian Johnson
Well, the system in question combines relative strength analysis (using price ratios) with a John Murphy-esque “intermarket” view of the world, and in doing so monitors the relative performances of equities (domestic and global), select commodities (oil, gold and silver), the US dollar, and long-dated US treasuries.
While it does not overweight or favor any one ratio over others, the ones that I’ve found to be particularly useful in terms of their abilities to time their respective denominators are:
US Dollar-to-Gold
US Dollar-to-Oil
Long-Dated Treasuries-to-US Equities
Outside of this system’s scope, I also monitor a number of other ratios that I’ve found to be useful. These include:
Financial Stocks-to-Utilities
Discretionary Stocks-to-Staples
Industrial Metals-to-Bonds
High-Yield Bonds-to-Mid-Term US Treasuries
At the moment, I’m particularly interested in that last one (High-Yield Bonds-to-Mid-Term US Treasuries ), as it has recently proved very adept at providing advanced warnings of short-term stock market tops and bottoms. High on my list of to-do’s is to attempt to incorporate it into my existing equity-only strategies (which have recently badly underperformed the broad market due in large part to their overly-simplistic timing mechanism).
Hope that information is helpful to you. I would of course be very interested in the results of any research you might pursue.
Thanks again Brian!
-Bill
PS – Sorry for the double reply. Fat fingers hard at work if you will 😉
Bill,
Thanks for the detailed reply. It is interesting that you mentioned Murphy. I think I have read all of his books; his research on inter-market analysis is probably his best and most insightful work.
I follow most of the ratios that you mentioned above and I use several as trend filters in my equity models. They work well on most time frames. I am not currently using the high-yield bonds to US Treasury ratio in my trading models, but it should be effective. The bond market tends to identify economic risk before the equity markets, which would lead to spread widening in high-yield bonds, which would cause them to lag US Treasuries. I will look into this further. I am using a similar credit spread measure in my recession and GDP forecasting models, so it would be logical to use the relative strength ratio in my trading strategies.
I wrote an article last year titled “Market Timing with Relative Strength Revisited” that demonstrates how to combine multiple “bullish” and “Bearish” symbols into a single relative strength ratio. If you missed it, you might find it interesting. It is often easier to use a single indicator in trading strategies than incorporating multiple relative strength ratios.
Thanks again for sharing your insights. Many investors overlook the information available through relative strength price ratios and you have given them a number of good ideas to get them started.
Best regards,
Brian Johnson
Well, the system in question combines relative strength analysis (using price ratios) with a John Murphy-esque “intermarket” view of the world, and in doing so monitors the relative performances of equities (domestic and global), select commodities (oil, gold and silver), the US dollar, and long-dated US treasuries.
While it does not overweight or favor any one ratio over others, the ones that I’ve found to be particularly useful in terms of their abilities to time their respective denominators are:
US Dollar-to-Gold
US Dollar-to-Oil
Long-Dated Treasuries-to-US Equities
Outside of this system’s scope, I also monitor a number of other ratios that I’ve found to be useful. These include:
Financial Stocks-to-Utilities
Discretionary Stocks-to-Staples
Industrial Metals-to-Bonds
High-Yield Bonds-to-Mid-Term US Treasuries
At the moment, I’m particularly interested in that last one (High-Yield Bonds-to-Mid-Term US Treasuries ), as it has recently proved very adept at providing advanced warnings of short-term stock market tops and bottoms. High on my list of to-do’s is to attempt to incorporate it into my existing equity-only strategies (which have recently badly underperformed the broad market due in large part to their overly-simplistic timing mechanism).
Hope that information is helpful to you. I would of course be very interested in the results of any research you might pursue.
Thanks again Brian!
-Bill