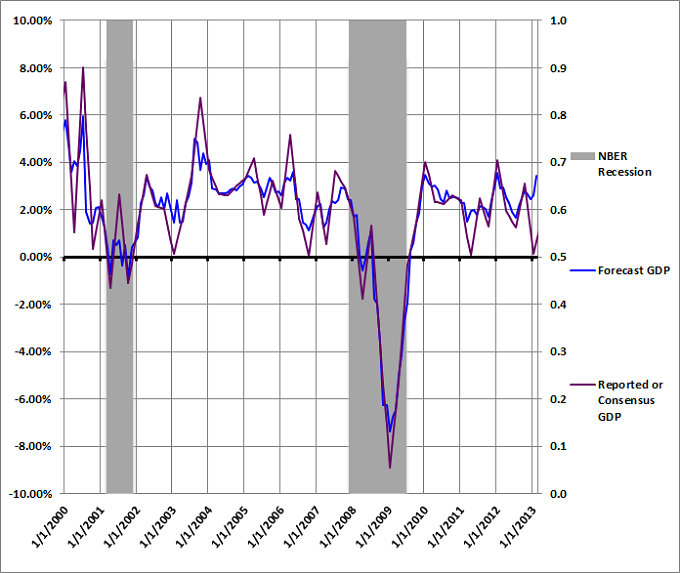
In January, I introduced a new aggregate neural network model that I developed to forecast the seasonally-adjusted, annualized, real rate of change in U.S. GDP. The GDP growth rate is only reported quarterly, but the model provides a rolling 3-month GDP growth rate forecast every month (with a one month lag). As a result, the model generates more timely information about the growth of the U.S. economy.
I have been doing recession research and constructing recession models for the past several months, which prompted me to develop the GDP model. If you are new to Trader Edge and would like some additional background on the development of the Trader Edge recession models, I encourage you to read a recent recession model update, which also has links to earlier articles.
Aggregate GDP Model
The Trader Edge aggregate GDP model represents the average of two neural network model forecasts. When constructing the two neural network GDP models, I started with the same data that I used to develop the recession models. For the first model, I identified the optimal look-back period for each of the independent variables and discarded variables that had limited explanatory power. I then estimated several neural network models with different architectures and retained the one with the best overall performance. For the second neural network model, I started with the same data, but let the neural network model choose the best combination of independent variables using a greedy algorithm.
Historical Results
The Trader Edge aggregate GDP model performed well historically. The standard error of the estimate was a respectable 0.74%. However, the forecast for the Q4 2012 GDP exceeded the reported GDP by over 2%. This was very unusual, but so was the Q4 GDP report.
As explained in previous posts, there were two major drags on GDP in the fourth quarter. Business inventories were drawn down and not replaced during the quarter. During periods of economic growth, this typically leads to increases in inventory in subsequent quarters, which spurs future GDP growth. As a result, this effect may be temporary, rather than the beginning of a new trend.
Government spending dropped by 6.6% during the quarter, which further dampened GDP growth. The decline in government spending could have been due to anticipation of the sequester. This effect may persist if the sequester cuts remain in place or are replaced by other spending reductions.
The model forecasts from 2000 to 2/1/2013 are included in Figure 1 below (blue). The purple line illustrates the actual quarterly GDP data. Both lines use the left vertical axis. The most recent "actual" GDP observation represents an interpolation of last quarter's actual data and next quarter's consensus forecast of +1.7%. The gray shaded regions represent past U.S. recessions as defined by the National Bureau of Economic Research (NBER).
Rolling GDP Forecast: Three Months Ending 02-01-2013
The interpolated, annualized real GDP growth rate for the three-month period ending 02-01-2013 was only 0.65%, which represents an increase of 0.55% from the recently reported GDP growth rate for the fourth quarter. The model estimate for the three months ending 02-01-2013 was a surprisingly strong 3.44%, up 0.81% from the revised Q4 2012 forecast of 2.63%. As was the case in the fourth quarter, the latest model forecast was significantly above the actual interpolated GDP data.
Conclusion
The GDP neural network model is still in the experimental stages. Unfortunately, it does not currently use any explanatory variables that measure the effects of inventory changes or reductions in government expenditures on GDP. This may limit the effectiveness of the model going forward if further austerity measures are implemented at the state and federal level. Time permitting, I would like to research new variables that could capture these effects on a timely basis.
Despite these limitations, the month to month increase in the rolling three month forecast is a very positive sign for the U.S. economy.
Feedback
Your comments, feedback, and questions are always welcome and appreciated. Please use the comment section at the bottom of this page or send me an email.
Referrals
If you found the information on www.TraderEdge.Net helpful, please pass along the link to your friends and colleagues or share the link with your social or professional networks.
The "Share / Save" button below contains links to all major social and professional networks. If you do not see your network listed, use the down-arrow to access the entire list of networking sites.
Thank you for your support.
Brian Johnson
Copyright 2013 - Trading Insights, LLC - All Rights Reserved.


Pingback: Earnings-Price Divergence Always Followed by Negative Returns | Trader Edge