I recently wrote about the extreme divergence between earnings and equity prices, but did not have access to comprehensive historical earnings data until recently. In the article above, I referenced the past few years of earnings data, which was provided by FactSet on their website. I am not a subscriber, but FactSet does offer free access to recent earnings data in graphical form in their weekly online publications.
While doing some economic research on the St. Louis Federal Reserve site (FRED), I discovered a quarterly data series on after-tax corporate profits that originated in 1947. The data series is titled "Corporate Profits After Tax with Inventory Valuation Adjustment and Capital Consumption Adjustment." I have only scratched the surface of the data, but the historical link between corporate profits and equity returns is compelling.
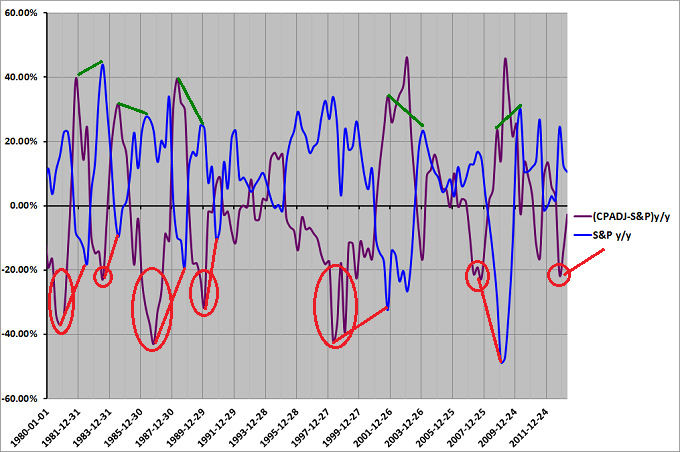
Every extreme divergence (-20% or lower) between year-over-year corporate profits and equity prices in the past 50 plus years was followed by negative year-over-year equity returns. Every one. This is especially relevant because this divergence dropped to -21.3% during the quarter ended 9/30/2012.
Corporate Profits versus S&P 500 Index Returns
The after tax corporate profit data mentioned above is published quarterly by the U.S. Commerce Department's Bureau of Economic Analysis in their gross domestic product release. The initial release is available approximately one month after the end of each quarter, although the data is subject to revisions.
The difference between the year-over-year percentage changes in after-tax corporate profits and the year-over-year percentage change in the S&P 500 index is plotted in purple in Figure 1 below. When this value is negative, the annual growth rate of corporate profits is below the return on the S&P 500 index. When the value is positive, the year-over-year percentage change in corporate profits is above the percentage change in price of the S&P 500 index.
The year-over-year change percentage change in the S&P 500 index is plotted in blue. All observations are plotted one month after the end of each quarter - to coincide with the initial GDP release date. Negative or bearish divergences were noted in red and positive or bullish divergences were marked in green. The red and green lines highlight the connection between extreme bearish or bullish divergences and the subsequent weak or strong performance of the S&P 500 index.
While the primary focus of this article is on bearish earnings-price divergences, extreme bullish divergences consistently led to very strong equity returns as well. To make the chart more readable, it only includes data from 1980 through Q1 2013.
Historical Observations
Excluding the most recent occurrence in 2012, there have only been nine instances when the year-over-year percentage change in after-tax corporate profits was at least 20% below the year-over-year percentage price change in the S&P 500 index. Note: extended periods of negative earnings-price divergence were classified as single instances.
Every period of extreme divergence was followed by one or more periods of negative year-over-year returns in the S&P 500 index. On average, the first negative year-over-year return occurred six quarters after the first quarterly extreme earnings-price divergence. The shortest lag between first extreme divergence and the first negative year-over-year return period was three quarters.
The longest lag was 11 quarters, but that was a very unusual period. It occurred at the height of the tech bubble from 1998 to 2001. During this period, earnings became almost irrelevant and equity valuations were completely unrealistic. Obviously prices eventually corrected and rational earnings multiples prevailed in the end, but the "irrational exuberance" continued far longer than many thought possible.
If we exclude the 1998-2001 outlier, the average lag between the first quarterly extreme earnings-price divergence and negative year-over-year returns drops to 5.3 quarters. Fortunately, the average lag period provides sufficient warning to preserve capital and protect against drawdowns.
When the historical periods of irrational exuberance ended, equity prices eventually converged toward earnings/profit growth. While there was obviously some overlap among the quarterly data, negative year-over-year returns continued for an average of 4.6 consecutive quarters.
Recent Earnings-Price Divergence
As mentioned above, the earnings-price divergence dropped to -21.3% during Q3 2012. Six months have elapsed since then. If the historical relationship between profits and prices holds true, the return of the S&P 500 should be negative over the next 12 months. And these negative year-over-year returns could continue for several additional quarters.
Conclusion
The latest Trader Edge recession forecast is benign and the most recent Trader Edge GDP forecast looks promising. Nevertheless, the historical link between profit growth and equity returns should not be ignored. Market corrections do not occur exclusively during recessionary periods. When equity prices diverge significantly from earnings or profit growth, equity prices eventually correct - every single time.
Feedback
Your comments, feedback, and questions are always welcome and appreciated. Please use the comment section at the bottom of this page or send me an email.
Referrals
If you found the information on www.TraderEdge.Net helpful, please pass along the link to your friends and colleagues or share the link with your social or professional networks.
The "Share / Save" button below contains links to all major social and professional networks. If you do not see your network listed, use the down-arrow to access the entire list of networking sites.
Thank you for your support.
Brian Johnson
Copyright 2013 - Trading Insights, LLC - All Rights Reserved.


Pingback: Q1 2013 GDP Model Forecast Below Consensus Estimate | Trader Edge
Pingback: S&P 500 Overvalued Based on Price to Sales Ratio | Trader Edge
Pingback: April 2013: Most Extreme Investor Leverage Since 2001 Bubble | Trader Edge
Very good article. I was thinking about the “great disconnect” mentioned by Gary Shilling and you’ve quantified. Great work!
Carl,
Thanks for the feedback. I have always believed that there should be a very strong link between earnings and equity prices, but I was still surprised by the strength of the divergence relationship in the historical data.
Best regards,
Brian Johnson