The Economic Cycle Research Institute (ECRI) is one of the leaders in business cycle forecasting, but they had one spectacular and very public forecasting failure in the fall of 2011 - when they predicted an imminent U.S. recession. Until that time, ECRI had never missed a recession forecast. Given ECRI's flawless track record, in early 2012 I decided to override several timely and very profitable buy signals from my systematic equity strategies. The opportunity cost was significant.
I learned an important lesson from this experience. It is very difficult to integrate external, proprietary research tools and forecasts into my investment process. While ECRI's track record was impressive, their proprietary process was opaque. As a result, I had no way of understanding or evaluating their recession forecast or its implications for my strategies.
This realization led me to develop the Trader Edge recession forecasting models. These models may or may not be superior to ECRI's framework, but at least I know every input variable and the mechanics behind each of the Trader Edge model forecasts.
As you might expect, I am somewhat biased when it comes to ECRI, but I am disappointed that they never revised their recession forecast, despite data from their own weekly leading indicator series that directly contradicted their earlier recession forecast.
Instead of reevaluating their forecast, they recently published a new report based on nominal GDP growth that purports to support their recession forecast from almost two years earlier. Unfortunately, using nominal GDP growth (in periods with wildly different inflationary environments) to identify recessionary periods is not a fundamentally sound approach. This article explores this relationship in more detail.
Nominal GDP Growth and Past U.S. Recessions
Figure 1 below is a graph from the recent ECRI report. The blue line represents the year-over-year growth in nominal GDP since 1980. The four shaded regions denote U.S. recessions. The segments of the line depicted in red indicate year-over-year nominal GDP growth below ECRI's recession threshold of 3.7%.
On the graph, I marked the beginning of each recession with a red arrow. As you can see, the year-over-year nominal GDP growth was drastically different at the beginning of each of the past four recessions. Why were they so different? Because of inflation!
In mid-1980, the annual inflation rate exceeded 14%. This explains how the U.S. could enter a recession when nominal GDP growth was so high - because real GDP growth was actually negative. The fact that nominal GDP growth eventually fell below 3.7% for a few months at the end of the recession is irrelevant and of no predictive value.
Similarly, in the early 1990s, the U.S. fell into another recession. At the time, nominal GDP growth was near 6%. The annual inflation rate was approximately 5%. This is not a coincidence. Recessionary periods are related to real GDP growth, not nominal GDP growth. As was the case in the 1980 recession, the nominal GDP growth rate eventually dropped below 3.7%, but not until the end of the recession.
The nominal GDP growth rate at the beginning of the 2001 recession was slightly lower, approximately 5%. Not surprisingly, the annual inflation rate was lower as well, approximately 4%. Again, recessions are related to real GDP growth, not nominal GDP growth. When inflation is low, recessions begin at lower nominal GDP growth rates.
We see the same relationship at the beginning of the 2008 recession. Nominal GDP growth was above 4% and inflation was also approximately 4%. Again, not a coincidence.
In an attempt to support their 2011 recession forecast, ECRI emphasizes that year-over-year nominal GDP growth has again dropped below 3.7%. They cite this as evidence that the U.S. is in a recession. Unfortunately, ECRI fails to recognize that the current rate of inflation has dropped to 1%. Nominal GDP growth of near 3.7% and annual inflation of 1% are consistent with the most recent estimate of Q1 2013 real GDP growth of 2.4%.
ECRI's Weekly Leading Indicator (WLI) Series
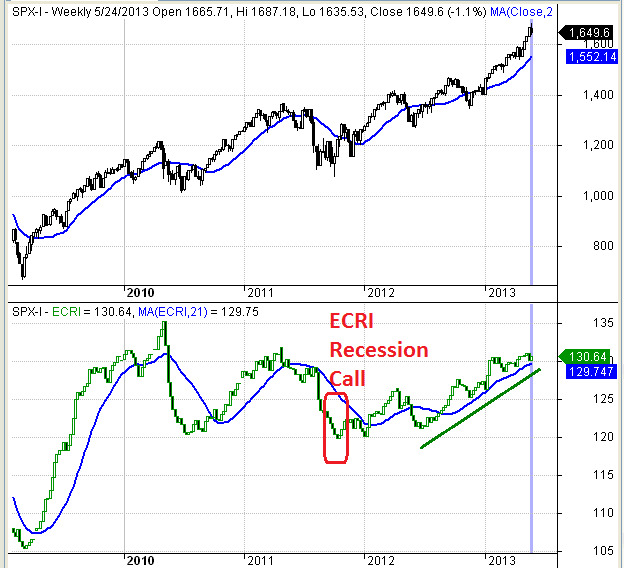
Figure 2 below includes candlestick charts of the S&P 500 index in the top panel and ECRI's proprietary weekly leading indicator series in the second panel.
As is evident in the chart above, the WLI was decreasing when ECRI announced their recession call in the fall of 2011. However, the WLI has increased significantly since early 2012. While the U.S. economy might suddenly reverse course and enter a recession, that scenario is not currently supported by the data - including ECRI's WLI data.
Conclusion
The equity market is overbought by technical measures, overvalued by fundamental metrics, and is long overdue for a correction. Nevertheless, the U.S. economic and market data is not consistent with past recessionary environments. It is disappointing that ECRI continues to cling to their 2011 recession call, despite overwhelming evidence to the contrary. It is even more disturbing that they are now focusing on nominal GDP growth to support their position.
Feedback
Your comments, feedback, and questions are always welcome and appreciated. Please use the comment section at the bottom of this page or send me an email.
Referrals
If you found the information on www.TraderEdge.Net helpful, please pass along the link to your friends and colleagues or share the link with your network connections.
The "Share / Save" button below contains links to all major social and professional networks. If you do not see your network listed, use the down-arrow to access the entire list of networking sites.
Thank you for your support.
Brian Johnson
Copyright 2013 - Trading Insights, LLC - All Rights Reserved


