In a recent article "Earnings-Price Divergence Always Followed by Negative Returns," I noted that every extreme divergence (-20% or lower) between year-over-year corporate profits and equity prices in the past 50 plus years was followed by negative year-over-year equity returns. Unfortunately, the earnings-price divergence dropped to -21.3% during the quarter ended 9/30/2012. While the relationship between extreme earnings-price divergences and negative year-over-year equity returns is compelling, the elevated price-to-sales ratio for the S&P 500 index provides even greater evidence the market is currently overvalued.
Price-to-Sales Ratio
The price-to-sales ratio is one of the most reliable metrics for systematically identifying undervalued securities. In an article titled "Proven Stock Screens Earn 20%+ Annual Returns," I demonstrated that it is possible to earn excess returns using valuation metrics like the price-to-sales ratio. As a result, it should be no surprise that the price-to-sales ratio also offers insight into the relative valuation of the overall equity market.
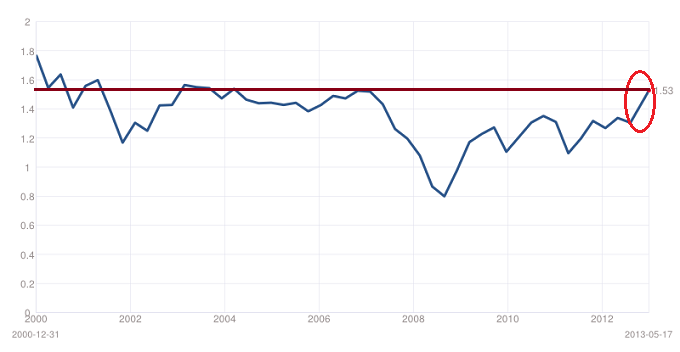
The chart in Figure 1 below represents the price-to-sales ratio for the S&P 500 index. It is one of the many economic and market-related data series available at Multpl.com, which was the source for the charts and data for this article. As you can see from the chart, the most recent price-to-sales ratio for the S&P 500 Index is 1.53, which is very near the peak level reached from 2002 to today. The price-to-sales ratio did exceed 1.53 prior to 2000, but that was during the tech bubble, which eventually burst in spectacular fashion.
The more interesting period was 2002 through 2007. Near the end of the recession in 2002, the price-to-sales ratio increased from a low of 1.17 to 1.56 in December of 2003. The rapid increase in the price-to-sales ratio reflected narrowing risk premiums as the economy emerged from the recession. The price-to-sales ratio drifted lower, then eventually spiked again in mid-2007, reaching a high of 1.52. It was all downhill from there as the U.S. economy entered the Great Recession of 2008.
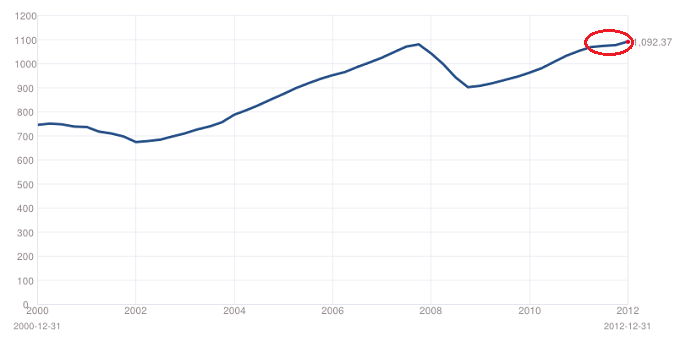
Given that the price-to-sales ratio was essentially flat from 2003 to 2007, how was the market able to generate positive returns during this period? The answer is increasing sales. From December 2003 to December 2007, S&P 500 sales increased by almost 45% (See Figure 2 below).
The beauty of sales is that they are difficult (but not impossible) to manipulate. Accountants have developed a myriad of tricks to manage earnings, but sales are much more reliable. As a result, the price-to-sales ratio is particularly valuable for security selection and for gaining insight into the relative value of the overall market.
Based on the price-to-sales framework, there are only two ways to generate positive price returns: an increase in sales and an increase in the price-to-sales ratio. As is evident in the above chart, the price-to-sales ratio has already reached an extreme level. It bottomed out in March of 2009 and increased rapidly in 2009 as the U.S. economy emerged from the Great Recession and growth prospects accelerated dramatically. For the next few years, the price-to-sales ratio fluctuated between 1.11 and 1.35, but sales increased, which fueled equity market returns during this period.
Unfortunately, sales growth has already begun to slow, which is not unexpected after a lengthy expansion period. S&P 500 sales only increased by 3.75% in 2012. Inexplicably, the price-to-sales ratio jumped from 1.31 in December of 2012 to 1.53 today, a 16.8% increase. While it certainly could increase further (as it did during the tech bubble), the odds are against a significant increase.
Conclusion
If the price-to-sales ratio is at historical extremes and S&P 500 sales growth has slowed to 3.75% (see red oval above), how will the equity market continue to generate attractive returns? How indeed?
According to the latest Trader Edge recession model and GDP model forecasts, there is no evidence that the U.S. economy is on the verge of another recession. However, corrections do not occur exclusively during recessions. When the market is overvalued, either prices must correct or sales and earnings must increase significantly to justify elevated price levels. Which is more likely four years into a relatively anemic expansion?
Feedback
Your comments, feedback, and questions are always welcome and appreciated. Please use the comment section at the bottom of this page or send me an email.
Referrals
If you found the information on www.TraderEdge.Net helpful, please pass along the link to your friends and colleagues or share the link with your social or professional networks.
The "Share / Save" button below contains links to all major social and professional networks. If you do not see your network listed, use the down-arrow to access the entire list of networking sites.
Thank you for your support.
Brian Johnson
Copyright 2013 - Trading Insights, LLC - All Rights Reserved.


Pingback: April 2013: Most Extreme Investor Leverage Since 2001 Bubble | Trader Edge