
When developing strategies, many systematic traders focus exclusively on technical analysis, with their primary focus on derivatives of price and volume. A few traders add sentiment and breadth statistics to further enhance their models. I suggest going one step further: apply economic filters to make your strategies even more robust and significantly reduce your losses.
The Problem with Shorting Stocks
When I began developing systematic strategies, the first lesson I learned was that it is extremely difficult to make money shorting stocks. Equities prices are biased to the upside. In addition to the overwhelming statistical evidence, there are fundamental reasons for the upside bias.
Companies use capital budgeting procedures to evaluate projects, only selecting projects with expected returns that exceed their weighted average cost of capital (WACC). On average, if these projects meet or exceed their projected cash flows, the value of the company should increase and the price of the stock should rise. As a result, when you short stocks, you are swimming against the current.
Unfortunately, there are other asymmetries that make shorting stocks even more difficult. Stock movements are more rapid and more severe to the downside than to the upside. This demonstrates the power of fear (or panic) over greed. When corrections or pullbacks do occur, then can occur very quickly. By the time technical models recognize these pullbacks and establish short positions, the correction is over and the market resumes its upward march. This leads to frustration and repeated losses.
As a result, short strategy signals should not be the mirror image of long strategy signals. To profit from the short side, your strategies should recognize and capitalize on the unique characteristics of downward price movements.
The most successful and reliable short equity trades occur during sustained downtrends, which only occur during recessions. This might seem obvious, but how could you use price and volume based technical indicators to determine if the economy were in a recession? The depth and length of the pullback would provide clues, but not timely ones. The answer is to incorporate economic data and/or economic forecasts into your systematic strategies.
Economic Data and Economic Forecasts
The good news about economic data is that it is widely available, often for free. One reliable source of free data is the Federal Reserve Economic Data (FRED), which is provided by the St. Louis Fed. Simply search for your desired data series and download the data into an Excel spreadsheet. You could also save the data as a CSV file and import the data into your research platform (such as AMIBroker). Commodity Systems Inc. (CSI) also provides a number of economic data series in addition to being a leading provider of market data.
Unfortunately, the problem with using raw economic data is the difficulty of using the data to determine when a recession begins and ends. This is particularly problematic because economic data is released with a lag. For those of you familiar with Trader Edge, you see where I am headed. Instead of using the raw data, use the data to develop reliable, real-time economic and recession forecasts and use those forecasts directly in strategies.
I recognized this deficiency in my investment process last year and spent several months developing the following tools.
Diffusion Index
The Trader Edge diffusion index equals the percentage of independent variables indicating a recession. There are a total of 16 explanatory variables, each with a unique look-back period and recession threshold. The resulting diffusion index and changes in the diffusion index are used to estimate the probit, logit, and neural network forecasting models.
The graph of the diffusion index from 1/1/2003 to 7/1/2013 is presented in Figure 1 below (in red - left axis). If you would like to view a graph of the earlier historical data (going back to 1960), please revisit A New Recession Slack Indicator. The gray shaded regions in Figure 1 below represent U.S. recessions as defined (after the fact) by the National Bureau of Economic Research (NBER). The value of the S&P 500 index is also included (in blue - right axis).
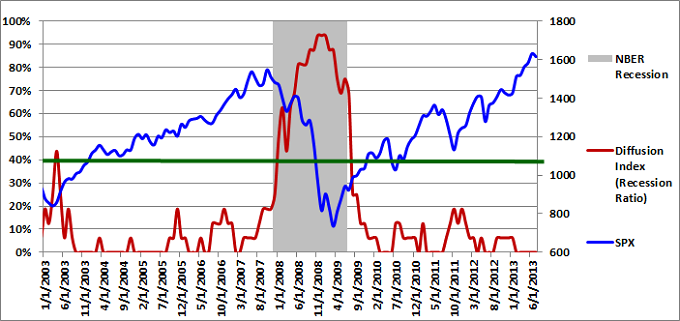
Figure 1: Diffusion Index 07-01-2013
Recession Slack Index
The Trader Edge recession slack index equals the median standardized deviation of the current value of the explanatory variables from their respective recession thresholds. The resulting value signifies the amount of slack or cushion relative to the recession threshold, expressed in terms of the number of standard deviations.
The gray shaded regions in Figure 2 below again represent U.S. recessions as defined (after the fact) by the NBER. The median recession slack index is depicted in purple and is plotted against the right axis, which is expressed as the number of standard deviations above the recession threshold.
The dark-red, horizontal line at 0.50 standard deviations denotes a possible warning threshold for the recession slack index. Many of the past recessions began when the recession slack index crossed below 0.50. Similarly, many of the past recessions ended when the recession slack index crossed back above 0.0.
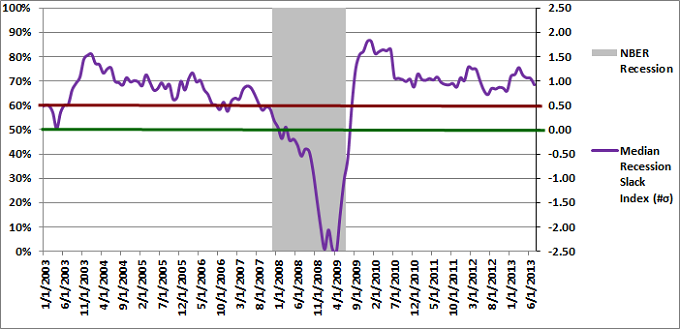
Figure 2: Median Recession Slack Index 07-01-2013
Aggregate Recession Probability Estimate
The Trader Edge aggregate recession model is the average of four models: the probit and logit models based on the diffusion index and the probit and logit models based on the recession slack index. The aggregate recession model estimates from 1/1/2003 to 7/1/2013 are depicted in Figure 3 below (red line - left vertical axis). The gray shaded regions represent NBER recessions and the blue line reflects the value of the S&P 500 index (right vertical axis). I suggest using a warning threshold of between 30-40% for the aggregate recession model (green horizontal line).
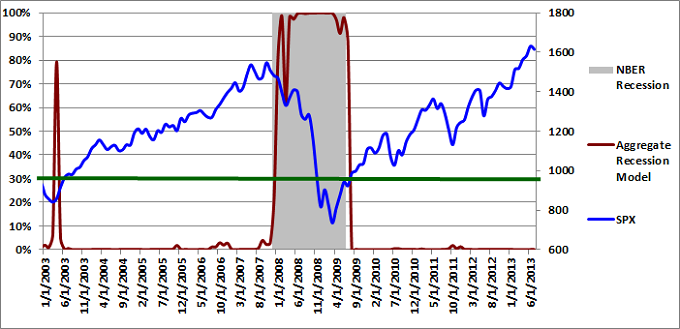
Figure 3: Aggregate Recession Model 07-01-2013
Aggregate Peak-Trough Probability Estimate
The peak-trough model forecasts are different from the recession model. The peak-trough models estimate the probability of the S&P 500 being between the peak and trough associated with an NBER recession. The S&P 500 typically peaks before recessions begin and bottoms out before recessions end. As a result, it is far more difficult for the peak-trough model to fit this data and the model forecasts have larger errors than the recession model.
The Trader Edge aggregate peak-trough model equals the weighted-average of nine different models: the probit and logit models based on the diffusion index, the probit and logit models based on the recession slack index, and five neural network models.
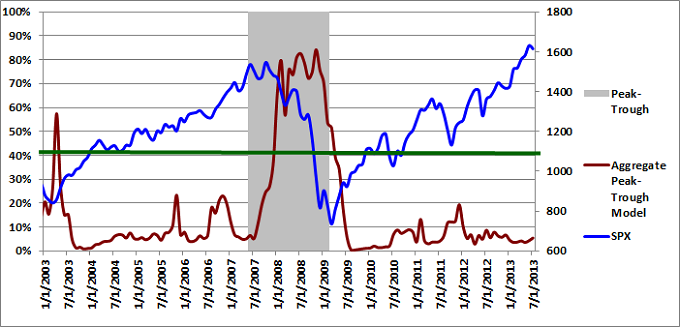
Figure 4: Aggregate Peak-Trough Model 07-01-2013
Strategy Integration
After developing the above forecasting tools, I went back and added new filters to all of my equity strategies to ensure that short trades only occur during periods of economic stress (although not necessarily during a recession). The resulting short equity trades are only executed during environments that are likely to support sustained downtrends. It is impossible to eliminate all losses, but these simple filters cut my systematic strategy drawdowns in half.
Feedback
Your comments, feedback, and questions are always welcome and appreciated. Please use the comment section at the bottom of this page or send me an email.
Referrals
If you found the information on www.TraderEdge.Net helpful, please pass along the link to your friends and colleagues or share the link with your social or professional networks.
The "Share / Save" button below contains links to all major social and professional networks. If you do not see your network listed, use the down-arrow to access the entire list of networking sites.
Thank you for your support.
Brian Johnson
Copyright 2013 - Trading Insights, LLC - All Rights Reserved.


