
Identifying trends and recognizing overbought and oversold conditions are the main objectives of technical analysis. This article introduces a new tool called the Volatility Adjusted Slope Indicator (VASI) that does all three simultaneously. The VASI is standardized, which means that it can be applied systematically to any price series over any time frame. I created two versions of the indicator; the AMIBroker code for both versions is included in this article.
The Volatility Adjusted Slope Indicator (VASI)
The inspiration for the VASI came from an article titled "The Repeated Median Velocity Strategy Part 1," which appeared in the November 2013 issue of Technical Analysis of Stocks and Commodities. The article was written by Dennis Meyers, PhD. In that article, Meyers introduced an indicator that represented the median of slope values that were derived from pairs of price observations over a specified look-back period.
I made four significant changes to Meyers's indicator:
- I used the central pivot price for the underlying price series to smooth the data
- I changed the pairs used for the slope calculations to make the indicator more responsive
- I adjusted the slope values using the volatility of the underlying price data
- I standardized the indicator for time, allowing consistent overbought and oversold readings
The central pivot price is the average of the high price, low price, and closing price for a specified period. Using the central pivot price instead of the closing price results in a smoother, more representative data series.
The standard VASI calculation uses symmetric pairs of price observations to calculate a series of slopes, which are then weighted. The user-specified period represents the number of price pairs. For example, if you entered five for the period, the standard VASI would initially calculate five slope calculations using five price pairs:
- CP0 and CP-10 (the central pivot price today and the central pivot price 10 periods in the past)
- CP-1 and CP-9
- CP-2 and CP-8
- CP-3 and CP-7
- CP-4 and CP-6
Notice that you entered five for the period and the standard VASI calculated five slope slopes, but that required the VASI to look back ten periods.
The Fast VASI calculation also uses pairs of price observations to calculate a series of slopes, which are also weighted. For the Fast VASI, the user-specified period also represents the number of price pairs, but the pairs are determined differently. For example, if you entered 10 for the period, the Fast VASI would initially calculate ten slope calculations using the following ten price pairs:
- CP0 and CP-1 (the central pivot price today and the central pivot price 1 period in the past)
- CP0 and CP-2
- CP0and CP-3
- CP0 and CP-4
- CP0 and CP-5
- CP0 and CP-6
- CP0 and CP-7
- CP0 and CP-8
- CP0 and CP-9
- CP0 and CP-10
The Fast VASI price pairs all end on the current date, which assigns more weight to the recent price observations. This makes the Fast VASI more responsive to recent changes in the trend.
After the slopes are calculated and weighted, both VASIs standardize the resulting slope value by adjusting for the volatility (Average True Range) of the underlying security and the number of periods used in the calculation. I will not go into more detail here, but if you are interested in the specific formulas, the AMIBroker code samples for both versions of the VASI are provided at the end of this article.
Gold and the VASI
Before we look at a specific example, here are some basics. The VASI values represent the strength and direction of the trend. Positive values represent bullish or up trends and negative values represent bearish or down trends. The sign of the VASI can therefore be used to identify the trend direction. To determine the long-term trend, increase the number of periods in the VASI calculation.
The strength of the trend can be determined by the magnitude of the VASI values. This means that the VASI can also be used as an oscillator as well as a trend indicator. Very strong trends are often unsustainable and lead to reversals, or at least to periods of consolidation. In the following example, I used extreme VASI thresholds of +0.80 and -0.80.
The top panel in Figure 1 below is a weekly candlestick chart of the continuous Gold futures contract (GC). The blue and red histogram bars in the second panel depict the standard five-period VASI values. The purple line is a three-period moving average of the standard VASI. The histogram bars in the third panel reflect the ten-period Fast VASI values. Remember that a five-period standard VASI and a ten-period Fast VASI both use ten periods, so they are directly comparable. As you would expect, the ten-period Fast VASI peaks slightly before the five-period standard VASI. We will use the VASI values to identify extreme overbought and oversold conditions.
The blue line in the fourth panel represents my proprietary commitments of traders (COT) indicator, which can be used to identify extreme positions by speculators and commercial traders, which often lead to high-probability turning points. If you would like to learn more using the commitments of traders data, please revisit Trade With the Experts. The COT indicator will be used to confirm the extreme overbought or oversold VASI conditions.
Finally, the histogram in the bottom panel depicts the values for the standard 33-period VASI. We will use the sign of this indicator to identify the long-term trend. Why did I choose 33 periods? Remember that the user-specified period for the standard VASI determines the number of slope pairs. Therefore, 33 means 33 slope pairs, which requires a look-back period of 66 trading days. There are approximately 22 trading days per month, so 66 trading days represents a 3-month period.
Now, let's look at the week of 10/5/2012 (vertical line in Figure 1 below). The price of the continuous Gold futures contract closed at 1791.21. The standard VASI was 0.97, well above the extreme value of 0.80. The Fast VASI was 0.69, which was below its three-period moving average of 0.80. In other words, the three-period moving average of the Fast VASI was above the extreme threshold and the Fast VASI had already begun to decline, indicating a possible trend reversal or consolidation.
The COT reading was -1.38, far beyond the extreme bearish threshold (red horizontal line at -0.50) for the COT indicator. This means that speculators already had massive long positions and did not have sufficient ammunition to continue buying. Conversely, the "smart money" commercial traders were extremely short (relative to their normal positions) as they often are prior to bearish reversals.
The above bearish setup appears to trade against the prevailing trend, which would normally be a sure way to lose money. However, take a look at the bottom panel. Again, the histogram in the bottom panel depicts the values for the standard 33-period VASI, which we can use to identify the longer-term trend (over the past three months). The histogram bar is red and the value of the 33-period standard VASI was -0.11. The longer-term trend was bearish.
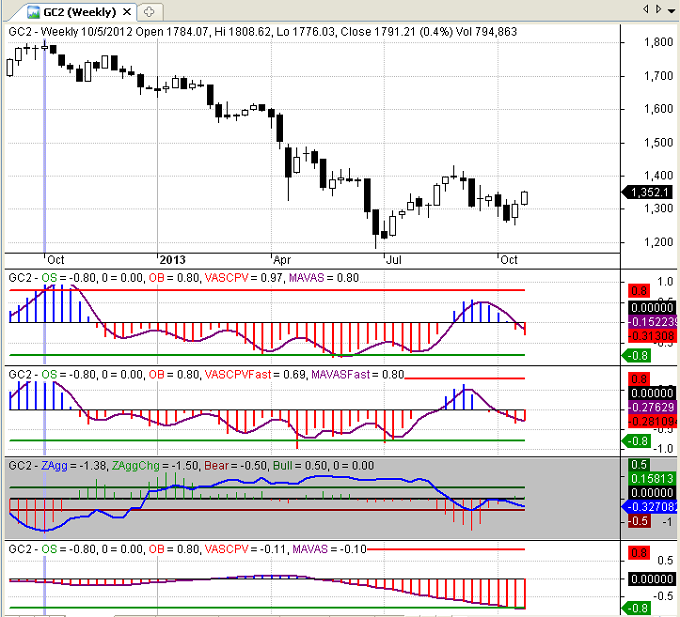
Figure 1: Volatility Adjusted Slope - Gold 2012-2013
The resulting short (bearish) trade would have been consistent with the longer-term trend, but would have sold when the short-term Gold prices were overbought and the trend was weakening, as evidenced by the decline in the Fast VASI below its moving average. In addition, the trade was also supported by an extreme bearish reading in the COT report, which confirmed this very high probability setup.
AMIBroker Code for the VASI
Figure 2 Below is a screenshot of the AMIBroker code for the Standard Volatility Adjusted Slope Indicator. I use a screenshot to display the code because my blog platform corrupts the code when it is copied and pasted. As a result, you would need to type the code manually into AMIBroker if you would like to experiment with the VASI. The code below complies and runs properly on my version of AMIBroker. As a result, if you encounter errors, they are probably due to typographical errors.

Figure 2: Standard VASI AMIBroker Code
Figure 3 below is a screen screenshot of the AMIBroker code for the Fast Volatility Adjusted Slope Indicator.
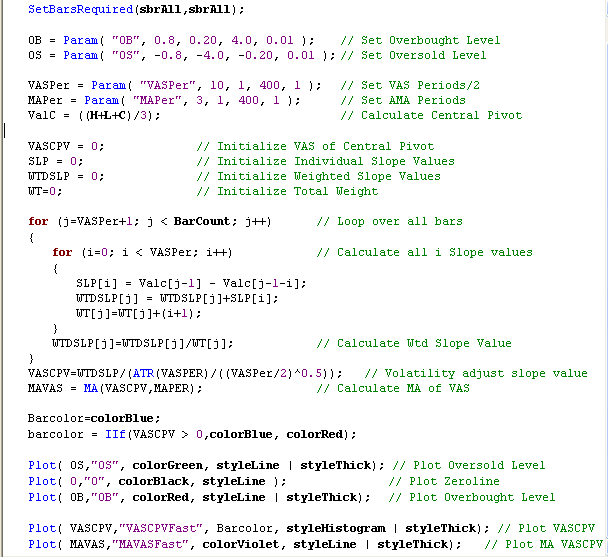
Figure 3: FAST VASI AMIBroker Code
Conclusion
Identifying trends and recognizing overbought and oversold conditions are the main objectives of technical analysis and the VASI meets all three objectives. When used as a short-term oscillator, the VASI can identify high-probability entries or profit-taking levels. However, when used as an entry signal, trades should only be entered in the same direction as the long-term trend, which can also be determined with the VASI. Finally, independent indicators, such as the COT indicator, should be used to confirm all trade signals.
Trader Edge Strategy E-Subscription Now Available: 20% ROR
The Trader Edge Asset Allocation Rotational (AAR) Strategy is a conservative, long-only, asset allocation strategy that rotates monthly among five large asset classes. The AAR strategy has generated 20%+ annual returns over the combined back and forward test period. Please use the above link to learn more about the AAR strategy.
Feedback
Your comments, feedback, and questions are always welcome and appreciated. Please use the comment section at the bottom of this page or send me an email.
Referrals
If you found the information on www.TraderEdge.Net helpful, please pass along the link to your friends and colleagues or share the link with your social or professional networks.
The "Share / Save" button below contains links to all major social and professional networks. If you do not see your network listed, use the down-arrow to access the entire list of networking sites.
Thank you for your support.
Brian Johnson


Quite interesting. Thanks for sharing.
Tomasz,
My pleasure. Thanks for your continued interest in Trader Edge.
Best regards,
Brian Johnson