
This article presents the Trader Edge aggregate neural network model forecast for the February 2014 non-farm payroll data, which is scheduled to be released tomorrow morning at 8:30 AM EST.
Non-Farm Payroll (NFP) Model Forecast - February 2014
The Trader Edge aggregate NFP model represents the average of three neural network forecasting models, each of which employs a different neural network architecture. Unlike expert systems, neural networks use algorithms to identify and quantify complex relationships between variables based on historical data. All three models derive their forecasts from seven explanatory variables and the changes in those variables over time.
The table in Figure 1 below includes the monthly non-farm payroll data for two months: January and February 2014. The January data was released last month and the non-farm payroll data for February 2014 will be released tomorrow morning at 8:30 AM EST.
The model forecasts are in the third data row of the table (in blue). Note that past and current forecasts reflect the latest values of the independent variables, which means that forecasts will change when revisions are made to the historical economic data.
The monthly standard error of the model is approximately 81,700 jobs. The first and last data rows of the table report the forecast plus 0.5 standard errors (in green) and the forecast minus 0.5 standard errors (in red), respectively. All values are rounded to the nearest thousand. If the model errors were normally distributed, roughly 31% of the observations would fall below -0.5 standard errors and another 31% of the observations would exceed +0.5 standard errors.
The actual non-farm payroll release for January 2014 is in the second data row of the table (in purple). The consensus estimate (reported by Briefing.com) for February 2014 is also in the second data row of the table (in purple). The reported and consensus NFP values also include the deviation from the forecast NFP (as a multiple of the standard error of the estimate). Finally, the last column of the table includes the estimated changes from January to February 2014.
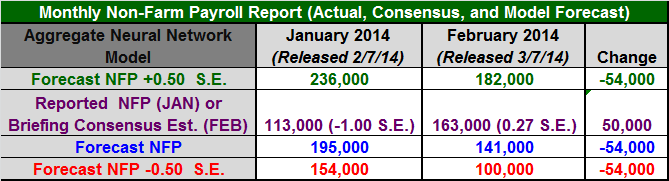
Figure 1: Non-Farm Payroll Table February 2014
Model Commentary
The aggregate neural network model forecast for February is 141,000, which is down 54,000 jobs from last month's revised forecast of 195,000. The Briefing.com consensus estimate for February is 163,000, which is 50,000 higher than the January NFP release. The actual January data was sharply below the revised January forecast (-1.00 S.E.) and the consensus estimate for February is modestly above the model forecast (+0.27 S.E.).
We saw the same pattern last month, which strongly suggests the actual January NFP data was adversely affected by weather. The actual NFP jobs data in January of 113,000 was a full standard error below the January estimate. This happened in December as well and the magnitude of the effect was even greater. Observations that far below the forecasts means that the actual NFP data in December and January data were inconsistent with the data from the explanatory variables.
The model is forecasting a significant decline in the NFP data from January to February (-54,000 jobs). However, one reason for the sharply lower forecast in February is the depressed NFP data for the last two months. The model uses past NFP data as one component of its current forecast. If the past data was affected by unusual adverse weather conditions, then it would also affect the current forecast.
It is interesting to note that the consensus estimate is for a 50,000 increase in NFP from January to February, which directly contradicts the model forecast change of minus 54,000 jobs. That disparity suggests that market participants believe that the January data was an anomaly and that the February data will be more representative of the actual employment conditions.
Given the data anomalies in December and January, which may or may not be due to the recent winter weather conditions, it will take another month or two of "normal" weather until we can get a clearer picture of the strength of the employment market.
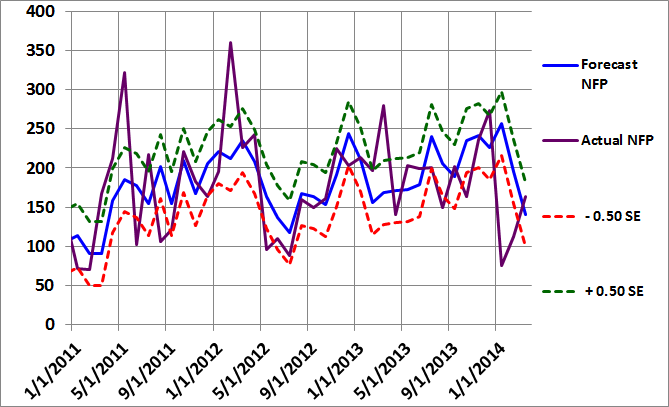
Figure 2: Non-Farm Payroll Graph February 2014
Summary
Basic forecasting tools can help you identify unusual consensus economic estimates, which often lead to substantial surprises and market movements. Identifying such environments in advance may help you protect your portfolio from these corrections and help you determine the optimal entry and exit points for your strategies.
In the case of the NFP data, the monthly report is notoriously unreliable and prone to substantial revisions. As a result, having an independent and unbiased indicator of the health of the U.S. job market is especially important.
Trader Edge Strategy E-Subscription Now Available: 20% ROR
The Trader Edge Asset Allocation Rotational (AAR) Strategy is a conservative, long-only, asset allocation strategy that rotates monthly among five large asset classes. The AAR strategy has generated 20%+ annual returns over the 20+ year combined back and forward test period. Please use the above link to learn more about the AAR strategy.
Feedback
Your comments, feedback, and questions are always welcome and appreciated. Please use the comment section at the bottom of this page or send me an email.
Referrals
If you found the information on www.TraderEdge.Net helpful, please pass along the link to your friends and colleagues or share the link with your social or professional networks.
The "Share / Save" button below contains links to all major social and professional networks. If you do not see your network listed, use the down-arrow to access the entire list of networking sites.
Thank you for your support.
Brian Johnson
Copyright 2014 - Trading Insights, LLC - All Rights Reserved.


