The recent sell-off in the equity markets and the dramatic increase in volatility has raised serious concerns among many traders and investors. The fact that the sell-off is occurring in October and the expansion is in its fifth year has further stoked those fears. The following article applies several different technical indicators to the Russell 2000 Index (RUT) in the weekly, monthly, and daily time frames.
RUT Weekly Analysis through 10-15-2014
The top panel in Figure 1 below is a weekly candlestick chart of RUT. The blue and violet lines are 21-week and 40-week moving averages respectively. The red line represents the CBOE Skew Index (axis not shown). The blue line in the second panel is my proprietary cumulative relative-strength market timing indicator (RSMTI). The violet line represents an intermediate-term moving average of the RSMTI and the dashed green line depicts a short-term moving average of the RSMTI. The red and green histogram bars depict the weekly changes in the cumulative RSMTI. The blue line in the third panel represents the accumulation distribution indicator and the violet line illustrates a moving average of the accumulation distribution indicator.
The blue line in the fourth panel represents the cumulative advance-decline line for the combined NYSE, NASDAQ, and AMEX exchanges. The other lines in the fourth panel represent moving averages of the advance-decline line. Finally, the blue line in the bottom panel represents the normalized short-term deviation of the advance-decline line and the violet line depicts its moving average. The red and green horizontal lines identify overbought and oversold thresholds that frequently identify probable reversals or consolidations.
Now, let's draw some conclusions from the chart. The first red vertical box in January of 2014 denotes the week that the RSMTI closed below its short-term moving average, forecasting a possible trend change. A few weeks later (next red vertical box), the short-term moving average of the RSMTI crossed below the intermediate-term moving average of the RSMTI, where it has remained throughout 2014. This confirmed the trend change warning. The RSMTI is one of the few indicators that leads price, often significantly. It has been very difficult historically for the equity market to sustain rallies in the face of weakening relative strength.
The red vertical box on the far right side of the chart notes the week that the cumulative advance decline line dropped below its moving average. If equity rallies are difficult to sustain during periods of weakening relative strength, they are almost impossible to sustain with declining breadth AND relative strength. The recent problems in the equity market should not be a surprise. The equity markets will not fully recover until both relative strength and breadth improve across all time frames.
On the positive side, the last panel illustrates that the equity markets are oversold, based on recent changes in breadth. However, as you can see from the chart, the markets can remain oversold or overbought for extended periods.

Figure 1: RUT Weekly 10-15-2014
RUT Monthly Analysis through 10-15-2014
The Monthly candlestick chart for RUT is depicted in Figure 2 below. The five panels contain the same indicators as Figure 1. Instead of focusing on the indicators in the panel, notice that the closing price of RUT dropped below the pink 17-month moving average line at the end of last month (September). Why is this significant?
In an early post titled "Take the First Step Toward an Investment Process," I demonstrated that a simple strategy based on a 17-month moving average would have materially outperformed a buy-and-hold strategy with far less risk. The 17-month moving average strategy remained invested in equities as long as the month-end closing price remained above its 17-month moving average. The balance of the time, the portfolio remained in cash. According to that simple strategy, RUT investors should have sold their positions at the end of September 2014. In other words, the RUT is now in a long-term downtrend.
Equally troubling is that the monthly RSMTI is below its short-term moving average, which is below its long-term moving average. Finally, the monthly accumulation distribution indicator recently dropped below its moving average and the cumulative advance decline line just crossed below one moving average and is approaching its second moving average.
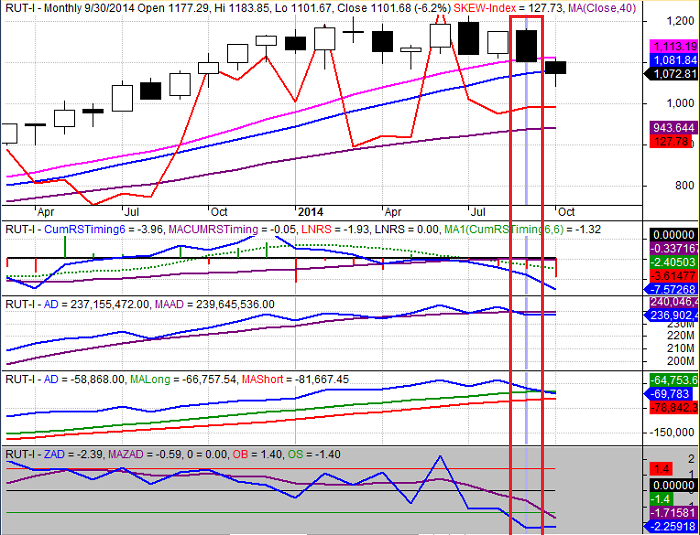
Figure 2: RUT Monthly 10-15-2014
RUT Daily Analysis through 10-15-2014
The daily candlestick chart for RUT is depicted in Figure 2 below. The five panels contain the same indicators as Figures 1 and 2. The primary trend information is gleaned from the monthly and weekly charts above, but the daily chart shows another red flag. The first red vertical bar below highlights the recovery day on October 8th, 2014. After declining the day before, RUT rebounded by 1.9% on the 8th, completely offsetting the prior day's loss of 1.7%. This type of reversal is typically very bullish for equities, but not in this case - and the warning sign is clearly depicted in the chart.
The daily change in the RSMTI is represented by the green and red histogram bars. On the strong up move on the 8th, the RSMTI was negative, suggesting that the rebound was not supported by relative strength. On the strong up day, the RSMTI should have been a large positive number; instead, it was negative. RUT rebounded again yesterday (10/15/14), but look at yesterday's RSMTI: negative again. This does not mean that the market will not rebound again in the next few days and I would certainly hesitate to read too much into any one indicator, especially for a single day, but the weakness in relative strength and breadth is very troubling across all time frames.
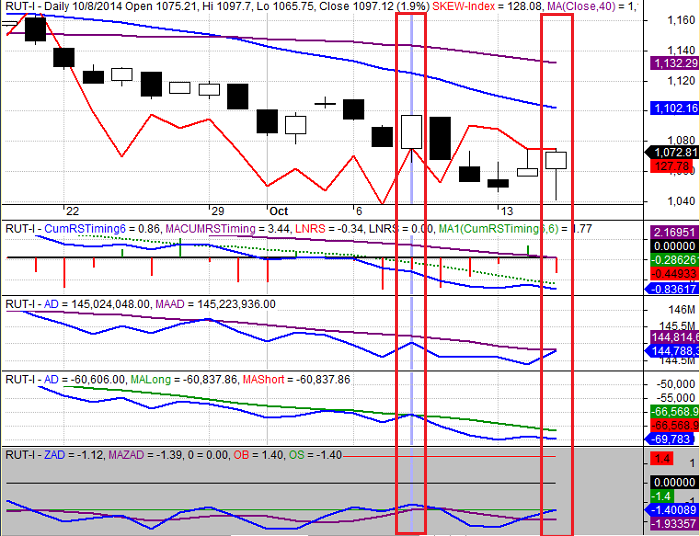
Figure 3: RUT Daily 10-15-2014
Conclusion
The technical indicators for RUT look worse than the indicators for the SPX and NDX, but RUT is frequently the canary in the coal mine. Unless breadth and relative strength begin to improve across all time frames, the bull-market in equities is on thin ice.
Print and Kindle Versions of Brian Johnson's New Book are Now Both Available on Amazon (21 5-Star Reviews)
Option Strategy Risk / Return Ratios: A Revolutionary New Approach to Optimizing, Adjusting, and Trading Any Option Income Strategy
Trader Edge Strategy E-Subscription Now Available: 20% ROR
The Trader Edge Asset Allocation Rotational (AAR) Strategy is a conservative, long-only, asset allocation strategy that rotates monthly among five large asset classes. The AAR strategy has generated approximately 20% annual returns over the combined back and forward test period (1/1/1990 to 7/29/2013). Please use the above link to learn more about the AAR strategy.
Feedback
Your comments, feedback, and questions are always welcome and appreciated. Please use the comment section at the bottom of this page or send me an email.
Referrals
If you found the information on www.TraderEdge.Net helpful, please pass along the link to your friends and colleagues or share the link with your social network.
The "Share / Save" button below contains links to all major social networks. If you do not see your social network listed, use the down-arrow to access the entire list of social networking sites.
Thank you for your support.
Brian Johnson
Copyright 2014 - Trading Insights, LLC - All Rights Reserved.
About Brian Johnson
I have been an investment professional for over 30 years. I worked as a fixed income portfolio manager, personally managing over $13 billion in assets for institutional clients. I was also the President of a financial consulting and software development firm, developing artificial intelligence based forecasting and risk management systems for institutional investment managers.
I am now a full-time proprietary trader in options, futures, stocks, and ETFs using both algorithmic and discretionary trading strategies.
In addition to my professional investment experience, I designed and taught courses in financial derivatives for both MBA and undergraduate business programs on a part-time basis for a number of years. I have also written four books on options and derivative strategies.


Equity Market Snapshot 10-15-2014
The recent sell-off in the equity markets and the dramatic increase in volatility has raised serious concerns among many traders and investors. The fact that the sell-off is occurring in October and the expansion is in its fifth year has further stoked those fears. The following article applies several different technical indicators to the Russell 2000 Index (RUT) in the weekly, monthly, and daily time frames.
RUT Weekly Analysis through 10-15-2014
The top panel in Figure 1 below is a weekly candlestick chart of RUT. The blue and violet lines are 21-week and 40-week moving averages respectively. The red line represents the CBOE Skew Index (axis not shown). The blue line in the second panel is my proprietary cumulative relative-strength market timing indicator (RSMTI). The violet line represents an intermediate-term moving average of the RSMTI and the dashed green line depicts a short-term moving average of the RSMTI. The red and green histogram bars depict the weekly changes in the cumulative RSMTI. The blue line in the third panel represents the accumulation distribution indicator and the violet line illustrates a moving average of the accumulation distribution indicator.
The blue line in the fourth panel represents the cumulative advance-decline line for the combined NYSE, NASDAQ, and AMEX exchanges. The other lines in the fourth panel represent moving averages of the advance-decline line. Finally, the blue line in the bottom panel represents the normalized short-term deviation of the advance-decline line and the violet line depicts its moving average. The red and green horizontal lines identify overbought and oversold thresholds that frequently identify probable reversals or consolidations.
Now, let's draw some conclusions from the chart. The first red vertical box in January of 2014 denotes the week that the RSMTI closed below its short-term moving average, forecasting a possible trend change. A few weeks later (next red vertical box), the short-term moving average of the RSMTI crossed below the intermediate-term moving average of the RSMTI, where it has remained throughout 2014. This confirmed the trend change warning. The RSMTI is one of the few indicators that leads price, often significantly. It has been very difficult historically for the equity market to sustain rallies in the face of weakening relative strength.
The red vertical box on the far right side of the chart notes the week that the cumulative advance decline line dropped below its moving average. If equity rallies are difficult to sustain during periods of weakening relative strength, they are almost impossible to sustain with declining breadth AND relative strength. The recent problems in the equity market should not be a surprise. The equity markets will not fully recover until both relative strength and breadth improve across all time frames.
On the positive side, the last panel illustrates that the equity markets are oversold, based on recent changes in breadth. However, as you can see from the chart, the markets can remain oversold or overbought for extended periods.
Figure 1: RUT Weekly 10-15-2014
RUT Monthly Analysis through 10-15-2014
The Monthly candlestick chart for RUT is depicted in Figure 2 below. The five panels contain the same indicators as Figure 1. Instead of focusing on the indicators in the panel, notice that the closing price of RUT dropped below the pink 17-month moving average line at the end of last month (September). Why is this significant?
In an early post titled "Take the First Step Toward an Investment Process," I demonstrated that a simple strategy based on a 17-month moving average would have materially outperformed a buy-and-hold strategy with far less risk. The 17-month moving average strategy remained invested in equities as long as the month-end closing price remained above its 17-month moving average. The balance of the time, the portfolio remained in cash. According to that simple strategy, RUT investors should have sold their positions at the end of September 2014. In other words, the RUT is now in a long-term downtrend.
Equally troubling is that the monthly RSMTI is below its short-term moving average, which is below its long-term moving average. Finally, the monthly accumulation distribution indicator recently dropped below its moving average and the cumulative advance decline line just crossed below one moving average and is approaching its second moving average.
Figure 2: RUT Monthly 10-15-2014
RUT Daily Analysis through 10-15-2014
The daily candlestick chart for RUT is depicted in Figure 2 below. The five panels contain the same indicators as Figures 1 and 2. The primary trend information is gleaned from the monthly and weekly charts above, but the daily chart shows another red flag. The first red vertical bar below highlights the recovery day on October 8th, 2014. After declining the day before, RUT rebounded by 1.9% on the 8th, completely offsetting the prior day's loss of 1.7%. This type of reversal is typically very bullish for equities, but not in this case - and the warning sign is clearly depicted in the chart.
The daily change in the RSMTI is represented by the green and red histogram bars. On the strong up move on the 8th, the RSMTI was negative, suggesting that the rebound was not supported by relative strength. On the strong up day, the RSMTI should have been a large positive number; instead, it was negative. RUT rebounded again yesterday (10/15/14), but look at yesterday's RSMTI: negative again. This does not mean that the market will not rebound again in the next few days and I would certainly hesitate to read too much into any one indicator, especially for a single day, but the weakness in relative strength and breadth is very troubling across all time frames.
Figure 3: RUT Daily 10-15-2014
Conclusion
The technical indicators for RUT look worse than the indicators for the SPX and NDX, but RUT is frequently the canary in the coal mine. Unless breadth and relative strength begin to improve across all time frames, the bull-market in equities is on thin ice.
Print and Kindle Versions of Brian Johnson's New Book are Now Both Available on Amazon (21 5-Star Reviews)
Option Strategy Risk / Return Ratios: A Revolutionary New Approach to Optimizing, Adjusting, and Trading Any Option Income Strategy
Trader Edge Strategy E-Subscription Now Available: 20% ROR
The Trader Edge Asset Allocation Rotational (AAR) Strategy is a conservative, long-only, asset allocation strategy that rotates monthly among five large asset classes. The AAR strategy has generated approximately 20% annual returns over the combined back and forward test period (1/1/1990 to 7/29/2013). Please use the above link to learn more about the AAR strategy.
Feedback
Your comments, feedback, and questions are always welcome and appreciated. Please use the comment section at the bottom of this page or send me an email.
Referrals
If you found the information on www.TraderEdge.Net helpful, please pass along the link to your friends and colleagues or share the link with your social network.
The "Share / Save" button below contains links to all major social networks. If you do not see your social network listed, use the down-arrow to access the entire list of social networking sites.
Thank you for your support.
Brian Johnson
Copyright 2014 - Trading Insights, LLC - All Rights Reserved.
About Brian Johnson
I have been an investment professional for over 30 years. I worked as a fixed income portfolio manager, personally managing over $13 billion in assets for institutional clients. I was also the President of a financial consulting and software development firm, developing artificial intelligence based forecasting and risk management systems for institutional investment managers. I am now a full-time proprietary trader in options, futures, stocks, and ETFs using both algorithmic and discretionary trading strategies. In addition to my professional investment experience, I designed and taught courses in financial derivatives for both MBA and undergraduate business programs on a part-time basis for a number of years. I have also written four books on options and derivative strategies.