Most investors do not use an investment process. Instead, they ask their friends for stock tips, watch CNBC, read a few newsletters (or blogs), and hope for the best. There is no consistent rationale behind their decision-making process, very little risk management, no concept of position sizing, and a limited chance of long-term success.
To be fair, developing an investment process can be a daunting task. This article will describe the various elements of an investment process and explain how to get started. You don't need to design the entire investment process at once; you can begin with one simple rule.
A Simple Investment Process
Before we explore the elements of an investment process, we need to start with a definition. An investment process is a set of objective rules or algorithms defining when to buy, when to sell, what to buy, what to sell, and how much to trade. While the process should continue to evolve as you gain experience and conduct additional research, the rules should never be changed for your existing positions.
Buy-and-hold is a very simplistic investment process and many investors have attempted to use this approach in the past. Unfortunately, they watched their equity values plummet in the 2001 and 2008 recessions and many panicked and sold at the bottom (so much for the "hold" concept). The ones who held on to their positions recouped some of their losses, but the ride was not a pleasant one.
If you would like to avoid a similar experience in the next recession, then you would need rules to determine when to sell and when to buy. To help you get started, I used the optimization function in my research platform (AMIBroker) to create a very simple investment strategy that was designed to trade with the prevailing trend and avoid serious losses during cyclical downturns.
The test period was from January 1, 1990 through May 31, 2012. The strategy invested 50% of equity in the S&P 500 index (SPX) and 50% of equity in the NASDAQ 100 index (NDX). Trade decisions were made monthly and all trades were made at month-end closing prices (ignoring transaction costs). In addition, the return data below does not include dividends, interest earned on cash balances, or taxes.
The rules were simple: buy when the monthly closing price of the index crossed above its 17-month simple moving average and sell (close the long position and return to cash) when the closing price of the index crossed below its 17-month simple moving average. Note: the strategy used monthly moving averages, monthly closing prices, monthly trade signals, and monthly transactions.
Using monthly periods eliminates many of the whipsaws that can occur when using daily or weekly periods. Finally, each trade also had a 10% stop loss, which could be triggered intra-month. This means the maximum loss on any individual trade was 10% (excluding overnight gaps).
What Were the Results?
The last row of the table in Figure 1 below documents the results for the 17-month moving average approach (described above). The results for the buy-and-hold approach are also reported for comparison purposes.
The moving average approach outperformed the buy-and-hold strategy by almost 2% per year. That might not seem like much, but over 20+ years the cumulative return difference was an astounding 369.86%. The difference between the maximum drawdowns for the two strategies was even more dramatic: -74.94% versus -22.59% (more on drawdowns below). The moving average approach had 20 trades, 75% of which were profitable. The average winning trade earned 70.59%, while the average losing trade only lost 4.56%. Only one trade was stopped out for the maximum 10% loss.
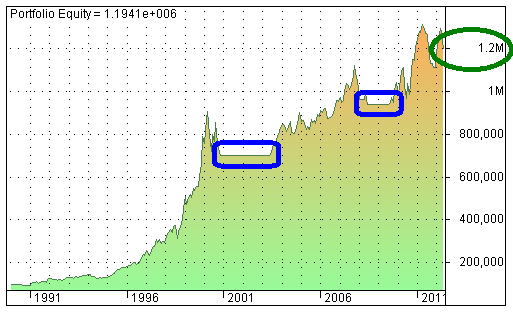
The cumulative equity graphs in Figures 2 & 3 below assume an initial investment of $100,000 on January 1, 1990.
The buy-and-hold equity value grew from $100,000 in 1990 to over $800,000 in 2012 (Figure 2 above). This was an impressive result, but it fell far short of the almost $1.2 million ending equity for the 17-month moving average approach (Figure 3 below).
The moving average strategy sold and returned to cash several times during the period, most notably during the 2001 and 2008 recessions (blue circles in Figure 3 above). This generated a much smoother equity curve and much smaller drawdowns than the buy-and-hold approach.
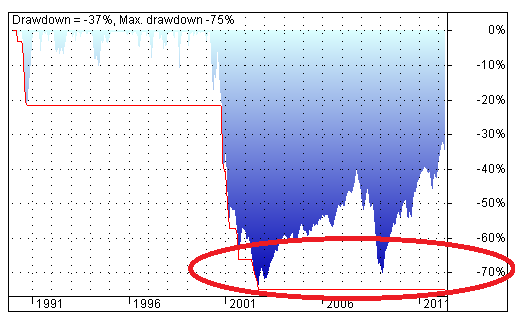
A drawdown is the percentage decline from the highest previous peak equity value. The drawdowns for the buy-and-hold strategy are depicted in Figure 4 below. The maximum drawdown was -75% in 2001, meaning the buy-and-hold investor would have suffered a 75% decline in equity from the peak value in early 2000. Even by the end of May in 2012, the buy-and-hold investor's equity was still 37% below its 2000 peak.
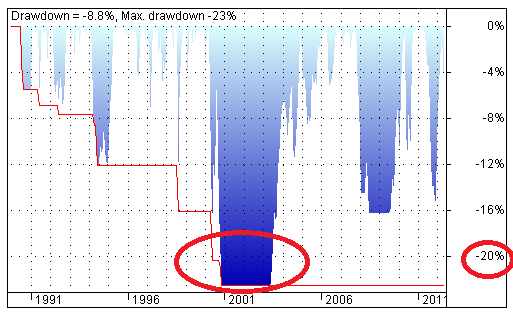
The story for the 17-month moving average approach was quite different. The maximum drawdown was for the moving average method was -22.59% (Figure 5 below), still unpleasant, but much more palatable than the -75% drawdown endured by the buy-and-hold investor. The ending equity for the moving average method was only 8.8% below the peak.
The reason the simple moving average approach worked is because of business cycles, which generate corresponding cycles in the equity markets that typically last several years. While the index price does occasionally penetrate the 17-month moving average and then continue to rise, history has shown that the risks of remaining fully invested in these environments far outweigh the potential rewards.
The 17-month simple moving average generated the highest compound annual return for the period from 1990 through May 2012. However, any moving average period from 15 to 37 would have outperformed the buy-and-hold strategy over this period - each with much less risk and significantly lower drawdowns.
The outperformance of the 17-month moving average strategy was not limited to the period from 1990 through May 2012. The 17-month moving average strategy also outperformed the buy-and-hold approach for periods beginning in 1950, 1960, 1970, 1980, 1990, and 2000. For each of those periods, the maximum drawdown for the 17-month moving average strategy was dramatically lower than the corresponding maximum drawdown for the buy-and-hold approach.
The above moving average strategy is simplistic, but robust. Historically, it has generated higher returns than buy-and-hold strategy with far less risk. The moving average method is not limited to market indices; it can be applied to individual stocks, currencies, and even commodities.
Ideally, you should use a research platform like AMIBroker to test your own rules and parameters for each market. Using objective trend following rules to determine when to be in and out of the market would be an excellent first step in your investment process.
Current Market Environment
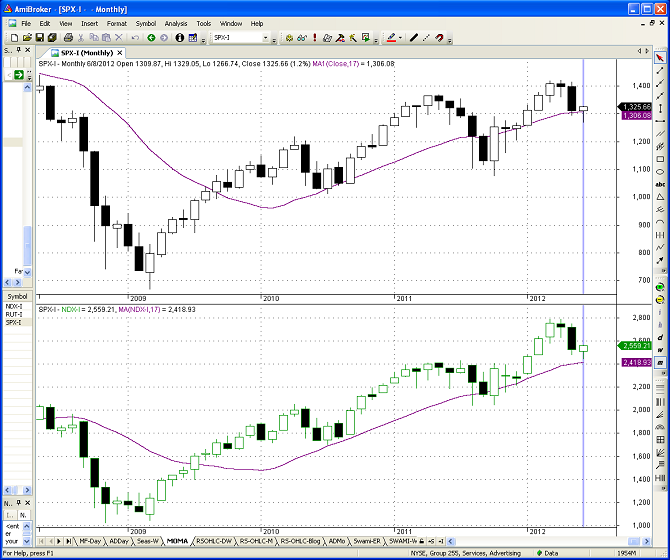
While there are many ways to improve upon the above moving average approach, this basic strategy has proven to be very useful in the past. The obvious and timely question is where are the SPX and NDX indices trading relative to their 17-month moving averages? Figure 6 below contains monthly candlestick charts for the SPX (top panel) and NDX (bottom panel) from 2009 through June 8, 2012 (last Friday). The 17-month moving average lines for both indices are depicted in purple.
As of last Friday, the SPX closed at 1325.66, only 1.5% above its 17-month moving average of 1306.08. The NDX closed at 2559.21, 5.8% above its 17-month moving average of 2418.93. Given the ongoing sovereign debt crisis in Europe and the recent stream of disappointing economic news out of China, the markets could move significantly between now and the end of June. Further weakening could cause both indexes to close below their respective moving averages in the near future. If you are curious about the Russell 2000 index, it already closed below its 17-month moving average (on May 31, 2012).
Further Investment Process Enhancements
Using a basic trend following rule to determine when to be in or out of the market is an important first step in any investment process, but there are many other tools and techniques that you could use to improve your process going forward.
Trading with the prevailing trend is one of the most important rules in trading, but a moving average is only one way to identify trend direction. You could also use long-term point and figure trend lines, point and figure buy and sell signals, trend line breaks, the advance decline line, relative strength ratios, and commitment of traders (COT) data to refine your entry and exit rules.
You could also use the modified efficiency ratio or the Friday indicator to prevent buying in overbought or selling in oversold environments. Finally, you could use seasonal trends and sector confirmation to improve your percentage of winning trades.
How do you determine what to buy? Consider using stock screens that have proven to be successful in the past or use a relative strength ranking system. What about risk management? Either base your exit rules on technical indicators or use one of the many stop methods available to control your risk. In either case, it is always important to use the appropriate position size for your trades to keep your losses manageable.
I have explained each of these techniques in past articles. Please use the above links to revisit some of these posts as you continue to refine your investment process.
Conclusion
An investment process can begin with one simple, objective rule, but it should continue to evolve over time. Your trading successes and (especially your) failures will help you identify necessary changes to your process. Every new trading article or blog post offers potential improvements in security selection, signal generation, or risk management. Ideally, you should have a research platform that allows you to test these ideas and to evaluate prospective strategies objectively.
Trading with a proven investment process that is consistent with your personal level of risk tolerance will give you the conviction to stick with your trading plan, even when markets are volatile. Always having stop losses and risk control measures in place will help you remove emotion from your trading and will greatly improve your long-term profitability
Feedback
Your comments, feedback, and questions are always welcome and appreciated. Please use the comment section at the bottom of this page or send me an email.
Do you have any questions about the material? What topics would you like to see in the future?
Referrals
If you found the information on www.TraderEdge.Net helpful, please pass along the link to your friends and colleagues or share the link with your social network.
The "Share / Save" button below contains links to all major social networks. If you do not see your social network listed, use the down-arrow to access the entire list of social networking sites.
Thank you for your support.
Brian Johnson
Copyright 2012 - Trading Insights, LLC - All Rights Reserved.
.


How can I generate a 17 month MA chart?
Alan,
I use AMI Broker as my research and charting platform. The cost is reasonable, but it is not a free service.
There is a free charting service on the web that offers monthly charts (http://www.freestockcharts.com). Select monthly charts from the drop down list, then use the add indicator drop down list to select moving average. Finally, edit the moving average and change the period to 17 (or any value you choose) from the default value.
You can select symbols from a wide range of categories in the section on the left hand side of the page.
Regards,
Brian Johnson
Pingback: Overcome the Odds | Trader Edge
Pingback: Equity Market Snapshot 10-16-2015 | Trader Edge
Pingback: Systematic Strategy Favors Cash Over Stocks | Trader Edge