This article presents the Trader Edge aggregate neural network model forecast for the September 2016 non-farm payroll data, which is scheduled to be released tomorrow morning at 8:30 AM EDT.
Non-Farm Payroll (NFP) Model Forecast - September 2016
The Trader Edge aggregate NFP model represents the average of three neural network forecasting models, each of which employs a different neural network architecture. Unlike expert systems, neural networks use algorithms to identify and quantify complex relationships between variables based on historical data. All three models derive their forecasts from seven explanatory variables and the changes in those variables over time.
The table in Figure 1 below includes the monthly non-farm payroll data for two months: August and September 2016. The August data was released last month and the non-farm payroll data for September 2016 will be released tomorrow morning at 8:30 AM EDT.
The model forecasts are in the third data row of the table (in blue). Note that past and current forecasts reflect the latest values of the independent variables, which means that forecasts will change when revisions are made to the historical economic data.
The monthly standard error of the model is approximately 82,000 jobs. The first and last data rows of the table report the forecast plus one standard error (in green) and the forecast minus one standard error (in red), respectively. All values are rounded to the nearest thousand. If the model errors were normally distributed, roughly 16% of the observations would fall below minus one standard error and another 16% of the observations would exceed plus one standard error.
The actual non-farm payroll release for August is in the second data row of the table (in purple). The consensus estimate (reported by Briefing.com) for September 2016 is also in the second data row of the table (in purple). The reported and consensus NFP values also include the deviation from the forecast NFP (as a multiple of the standard error of the estimate). Finally, the last column of the table includes the estimated changes from August to September 2016.
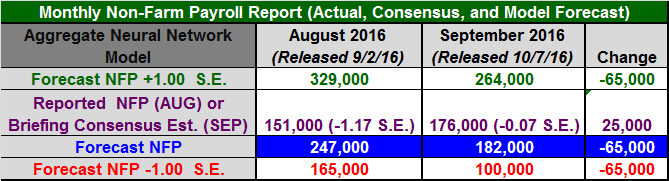
Figure 1: Non-Farm Payroll Table September 2016
Model Commentary
The aggregate neural network model forecast for September is 182,000, which is down sharply (-65,000) from last months forecast of 247,000, reflecting a rapid deterioration in the employment environment during the month of September. The Briefing.com consensus estimate for September is 176,000, which is up modestly (+25,000) from the actual August NFP data (151,000).
The actual August data was significantly below the forecast (-1.17 S.E.). The consensus estimate for September is very close to the September model forecast (-0.07 S.E.). The very low payroll number in August is not supported by the model data and is probably an outlier. This significantly increases the probability of a large upside surprise tomorrow, despite the close proximity of the consensus estimate and the model forecast.
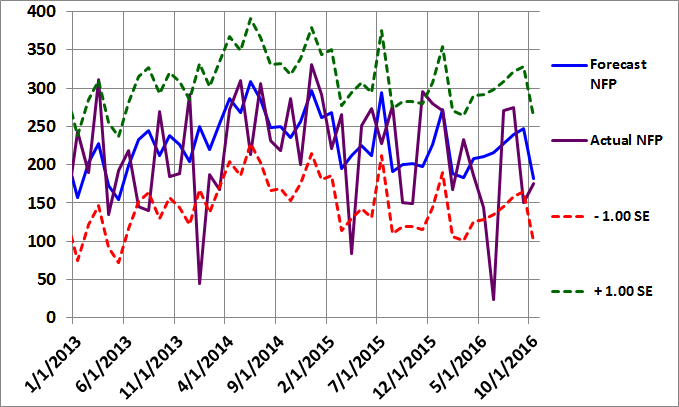
Figure 2: Non-Farm Payroll Graph September 2016
I added a new chart recently (Figure 3 below) to make it easier to observe trends in the employment environment. The blue line depicts the model forecasts (including the latest revisions) and is exactly the same as the Forecast NFP line in Figure 2 above. However, Figure 3 also contains a purple line, which shows the 12-month moving average of the NFP model forecasts.
Why plot the moving average of the model forecasts instead of the actual NFP data? Because the actual NFP data is notoriously noisy. The Forecast NFP data more accurately captures the strength of the employment environment and the stability of the data series makes it easier to observe the trend in employment.
We can use the chart below in Figure 3 in two ways to identify the trend in employment. First, we can observe the forecast NFP data relative to the moving average. Observations below the moving average indicate a weakening in employment and vice versa. Second, we can observe the slope of the moving average line. When the moving average line is downward-sloping, employment is weakening and vice versa.
As you can see from the chart in Figure 3, the slope had been negative since early 2015, but recently stabilized and turned positive last month. Unfortunately, the slope turned down again this month and the current model forecast is once again below the moving average. This reverses the recent trend; the forecast NFP data has been above the moving average for the past four months.
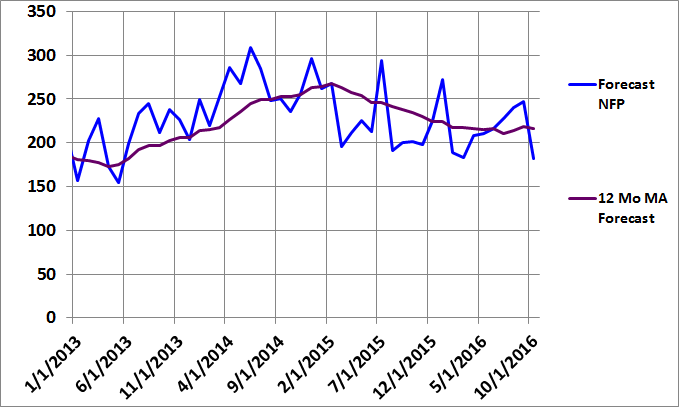
Figure 3: NFP Forecast MA Graph September 2016
Summary
The large negative August payroll data outlier significantly increases the probability of a large upside surprise tomorrow, despite the close proximity of the consensus estimate and the model forecast in September. If the negative outlier is reversed in September, the actual September data would significantly exceed the consensus estimate. This would hold the Fed's feet to the fire by providing additional support for a rate increase. The Fed claims to be apolitical, but a very strong September NFP report would test that claim. The futures market assigns a very low probability (currently only 15%) to the Fed raising rates before the November election.
Basic forecasting tools can help you identify unusual consensus economic estimates, which often lead to substantial surprises and market movements. Identifying such environments in advance may help you protect your portfolio from these corrections and help you determine the optimal entry and exit points for your strategies.
In the case of the NFP data, the monthly report data is highly variable and prone to substantial revisions. As a result, having an independent and unbiased indicator of the health of the U.S. job market is especially important.
Print and Kindle Versions of Brian Johnson's 2nd Book are Available on Amazon (75% 5-Star Reviews)
Exploiting Earnings Volatility: An Innovative New Approach to Evaluating, Optimizing, and Trading Option Strategies to Profit from Earnings Announcements.
Print and Kindle Versions of Brian Johnson's 1st Book are Available on Amazon (79% 5-Star Reviews)
Option Strategy Risk / Return Ratios: A Revolutionary New Approach to Optimizing, Adjusting, and Trading Any Option Income Strategy
Brian Johnson
Copyright 2016 Trading Insights, LLC. All Rights Reserved.
About Brian Johnson
I have been an investment professional for over 30 years. I worked as a fixed income portfolio manager, personally managing over $13 billion in assets for institutional clients. I was also the President of a financial consulting and software development firm, developing artificial intelligence based forecasting and risk management systems for institutional investment managers.
I am now a full-time proprietary trader in options, futures, stocks, and ETFs using both algorithmic and discretionary trading strategies.
In addition to my professional investment experience, I designed and taught courses in financial derivatives for both MBA and undergraduate business programs on a part-time basis for a number of years. I have also written four books on options and derivative strategies.


Non-Farm Payroll (NFP) Model Forecast – September 2016
This article presents the Trader Edge aggregate neural network model forecast for the September 2016 non-farm payroll data, which is scheduled to be released tomorrow morning at 8:30 AM EDT.
Non-Farm Payroll (NFP) Model Forecast - September 2016
The Trader Edge aggregate NFP model represents the average of three neural network forecasting models, each of which employs a different neural network architecture. Unlike expert systems, neural networks use algorithms to identify and quantify complex relationships between variables based on historical data. All three models derive their forecasts from seven explanatory variables and the changes in those variables over time.
The table in Figure 1 below includes the monthly non-farm payroll data for two months: August and September 2016. The August data was released last month and the non-farm payroll data for September 2016 will be released tomorrow morning at 8:30 AM EDT.
The model forecasts are in the third data row of the table (in blue). Note that past and current forecasts reflect the latest values of the independent variables, which means that forecasts will change when revisions are made to the historical economic data.
The monthly standard error of the model is approximately 82,000 jobs. The first and last data rows of the table report the forecast plus one standard error (in green) and the forecast minus one standard error (in red), respectively. All values are rounded to the nearest thousand. If the model errors were normally distributed, roughly 16% of the observations would fall below minus one standard error and another 16% of the observations would exceed plus one standard error.
The actual non-farm payroll release for August is in the second data row of the table (in purple). The consensus estimate (reported by Briefing.com) for September 2016 is also in the second data row of the table (in purple). The reported and consensus NFP values also include the deviation from the forecast NFP (as a multiple of the standard error of the estimate). Finally, the last column of the table includes the estimated changes from August to September 2016.
Figure 1: Non-Farm Payroll Table September 2016
Model Commentary
The aggregate neural network model forecast for September is 182,000, which is down sharply (-65,000) from last months forecast of 247,000, reflecting a rapid deterioration in the employment environment during the month of September. The Briefing.com consensus estimate for September is 176,000, which is up modestly (+25,000) from the actual August NFP data (151,000).
The actual August data was significantly below the forecast (-1.17 S.E.). The consensus estimate for September is very close to the September model forecast (-0.07 S.E.). The very low payroll number in August is not supported by the model data and is probably an outlier. This significantly increases the probability of a large upside surprise tomorrow, despite the close proximity of the consensus estimate and the model forecast.
Figure 2: Non-Farm Payroll Graph September 2016
I added a new chart recently (Figure 3 below) to make it easier to observe trends in the employment environment. The blue line depicts the model forecasts (including the latest revisions) and is exactly the same as the Forecast NFP line in Figure 2 above. However, Figure 3 also contains a purple line, which shows the 12-month moving average of the NFP model forecasts.
Why plot the moving average of the model forecasts instead of the actual NFP data? Because the actual NFP data is notoriously noisy. The Forecast NFP data more accurately captures the strength of the employment environment and the stability of the data series makes it easier to observe the trend in employment.
We can use the chart below in Figure 3 in two ways to identify the trend in employment. First, we can observe the forecast NFP data relative to the moving average. Observations below the moving average indicate a weakening in employment and vice versa. Second, we can observe the slope of the moving average line. When the moving average line is downward-sloping, employment is weakening and vice versa.
As you can see from the chart in Figure 3, the slope had been negative since early 2015, but recently stabilized and turned positive last month. Unfortunately, the slope turned down again this month and the current model forecast is once again below the moving average. This reverses the recent trend; the forecast NFP data has been above the moving average for the past four months.
Figure 3: NFP Forecast MA Graph September 2016
Summary
The large negative August payroll data outlier significantly increases the probability of a large upside surprise tomorrow, despite the close proximity of the consensus estimate and the model forecast in September. If the negative outlier is reversed in September, the actual September data would significantly exceed the consensus estimate. This would hold the Fed's feet to the fire by providing additional support for a rate increase. The Fed claims to be apolitical, but a very strong September NFP report would test that claim. The futures market assigns a very low probability (currently only 15%) to the Fed raising rates before the November election.
Basic forecasting tools can help you identify unusual consensus economic estimates, which often lead to substantial surprises and market movements. Identifying such environments in advance may help you protect your portfolio from these corrections and help you determine the optimal entry and exit points for your strategies.
In the case of the NFP data, the monthly report data is highly variable and prone to substantial revisions. As a result, having an independent and unbiased indicator of the health of the U.S. job market is especially important.
Print and Kindle Versions of Brian Johnson's 2nd Book are Available on Amazon (75% 5-Star Reviews)
Exploiting Earnings Volatility: An Innovative New Approach to Evaluating, Optimizing, and Trading Option Strategies to Profit from Earnings Announcements.
Print and Kindle Versions of Brian Johnson's 1st Book are Available on Amazon (79% 5-Star Reviews)
Option Strategy Risk / Return Ratios: A Revolutionary New Approach to Optimizing, Adjusting, and Trading Any Option Income Strategy
Brian Johnson
Copyright 2016 Trading Insights, LLC. All Rights Reserved.
About Brian Johnson
I have been an investment professional for over 30 years. I worked as a fixed income portfolio manager, personally managing over $13 billion in assets for institutional clients. I was also the President of a financial consulting and software development firm, developing artificial intelligence based forecasting and risk management systems for institutional investment managers. I am now a full-time proprietary trader in options, futures, stocks, and ETFs using both algorithmic and discretionary trading strategies. In addition to my professional investment experience, I designed and taught courses in financial derivatives for both MBA and undergraduate business programs on a part-time basis for a number of years. I have also written four books on options and derivative strategies.