Stock prices have had an impressive run, especially considering the risks facing the global economy and the growing uncertainties fueled by the looming fiscal cliff and the upcoming election. During the recent market advance, investors have become increasingly complacent, evidenced by declining levels of both implied and historical volatility. The market rally will be tested in September, which historically has been the worst month of the year for stocks.
Stocks: The September Effect
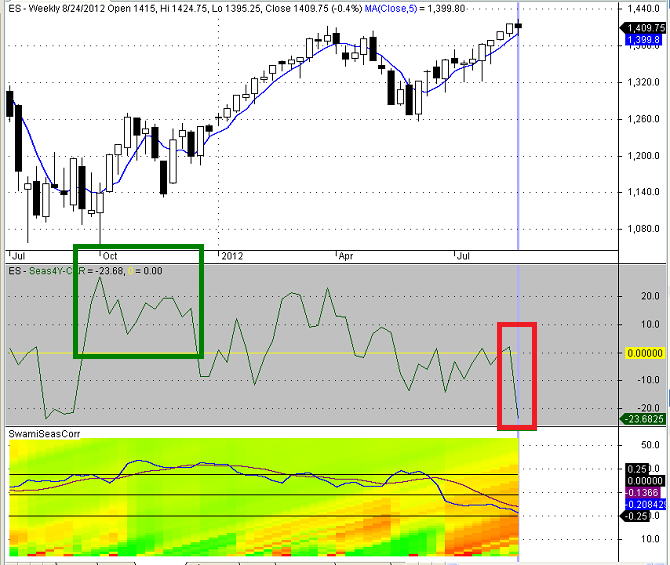
The top panel in Figure 1 below is a weekly candlestick chart of the E-mini S&P 500 continuous futures contract through Friday August 24, 2012. The second panel is one of my custom seasonal indicators, which calculates the average compound annual return earned over a 30-day holding period for all beginning dates throughout the calendar year. The calculation assigns a higher weight to more recent periods. Finally, the bottom panel in Figure 1 is a custom SWAMI seasonal correlation chart, which evaluates how accurately the recent price behavior matches the historical pattern.
As you can see by the indicator value in the second panel (inside the red box), the historical compound annual 30-day return for the S&P 500 index is -23.68%, which is the lowest value of the year. The recent price behavior has not matched the historical seasonal pattern (see third panel), which may mitigate the risk of a pullback in September, but there is still cause for concern. The seasonal pattern does not turn bullish again until early October (green box in second panel below).
Historical Volatility: The September Effect
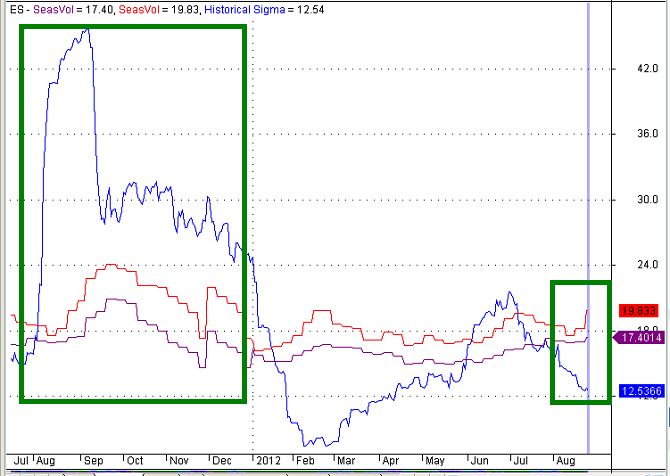
Reduced volatility typically goes hand-in-hand with a market rally and the recent uptrend is no exception. The blue line in Figure 2 below represents the annualized historical volatility for the E-mini S&P 500 (ES) continuous futures contract. The purple and red lines are the weekly average annualized historical volatilities calculated over two different long-term periods.
As you can see from the chart in Figure 2, the current level of historical volatility of 12.54% is far below the seasonal historical volatilities of 17.40% and 19.83% normally experienced during the last week in August (see green box on the right side of the chart).
The box on the left side of the chart depicts the historical volatility of the ES contract from August to December last year. Volatility normally increases in August and September, peaking in late September or early October. Last year the historical volatility of the ES contract spiked to over 42% (blue line) in late August in an exaggerated example of the normal seasonal volatility pattern for the ES contract.
The seasonal increase in volatility in September is consistent with the seasonal decline in equity prices. Volatility and equity prices are negatively correlated.
- Figure 1: E-Mini S&P 500 Seasonal Historical Volatility
Conclusion
Given the recent run-up in prices and sharp decline in volatility, the market is overdue for a correction. Negative seasonal factors, overhead resistance, and a whole smorgasbord of external risks may finally be sufficient to break the back of the uptrend
Feedback
Your comments, feedback, and questions are always welcome and appreciated. Please use the comment section at the bottom of this page or send me an email.
Do you have any questions about the material? What topics would you like to see in the future?
Referrals
If you found the information on www.TraderEdge.Net helpful, please pass along the link to your friends and colleagues or share the link with your social network.
The "Share / Save" button below contains links to all major social networks. If you do not see your social network listed, use the down-arrow to access the entire list of social networking sites.
Thank you for your support.
Brian Johnson
Copyright 2012 - Trading Insights, LLC - All Rights Reserved.
.


I continue to enjoy your cogent articles week after week. I’d like to respond to your request for topics for future articles. As a retired physicist I tend to favor analysis systems that use statistical backtesting and walkforward testing. In monitoring price series it is clear that basic technical analysis tools such as support and resistance lines and even trend lines are powerful tools but don’t seem to be adaptable to computerized testing. The proposed topic then is “How to work with support,resistance and trend lines in an otherwise back testing system.
Best regards
Pete Kasper
Pete,
Thanks for a great suggestion. While chart patterns (such as trendlines) are easy to draw on a chart, they are notoriously difficult to program for use in systematic strategies. In my recent article “How to Draw Trendlines & Avoid Severe Losses” I provided an objective procedure for constructing trendlines. It will take me some time, but I will begin to experiment with automated trendlines in AMIBroker. If I can come up with a practical solution, I will provide it in a future post.
In the interim, here are my initial thoughts regarding the steps required to code a daily bullish support line (as described in my earlier post).
1. Find the lowest low value over the previous user-defined N days (that would be the beginning point of the support line).
2. Find the highest high value that occurred on any day after the lowest low from step one (up to and including the current day).
3. Calculate the slope of each line from the low at point one to the low of each successive day (for all days after step one up to and including step two – but not beyond the date of the highest high value found in step 2).
4. The line with the lowest (shallowest) slope would be the correct support line.
5. Each intermediate point on the support line could be found by using the low from step one and the slope of the line found in step four.
6. The support line would be drawn from the lowest low found in Step one to the current day.
7. Trend line breaks could be found by comparing low or closing values to the calculated value of the support line. By definition, trendline breaks can only occur after the date of the highest high.
I hope you find the above algorithm helpful in the interim. I just began working on the series of 11 trading rules for the blog, but I will begin to research this as well.
Thanks again for the suggestion and for your continued interest in Trader Edge.
Best regards,
Brian Johnson