In the December 2007 issue of Futures Magazine, Larry Williams described his Price, Open Interest, and Volume (POIV) indicator and he also included the formula for POIV, which allows us to reproduce the indicator calculations. The following post reexamines the POIV indicator calculation (including the AMIBroker code) and demonstrates how to apply the POIV indicator using two timely futures contract examples.
POIV Indicator
Below is the formula for POIV from Larry Williams's 2007 article in Futures Magazine:
POIV = "CumulativeSum (Open Interest * (Close - Close.1) / (True High - True Low)) + OBV"
Let's start with the easy part first. OBV stands for On Balance Volume, which is a running total of volume, except that we add volume on up days (higher closes) and subtract volume on down days (lower closes). The OBV calculation measures the level of volume supporting price movements and gives greater weight to price movements on high volume days than on low volume days.
Volume in futures is important, but so is open interest. Open interest represents the total number of futures contracts outstanding. Unlike stocks, which have a relatively stable number of shares outstanding, open interest in futures markets changes continuously. As a result, open interest can be used to provide insight into the level of accumulation and distribution in futures markets. The first portion of the formula captures the effects of changing open interest.
Similar to the OBV calculation, the first term in the formula represents a cumulative sum of open interest over the entire price history. On up days (days with higher closes), we add a portion of the open interest to the running total and on down days (days with lower closes), we subtract a fraction of the open interest from the running total. The fraction represents the price movement (close to close) as a percentage of the true range.
Applying the POIV Indicator
The units in the POIV calculation are expressed in terms of the number of contracts, so the level of the POIV cannot be compared directly to price. In addition, the absolute level of the POIV is not relevant. So, how do we use the POIV? We use divergences between the POIV and the price of the futures contract to identify situations when price changes are not supported by comparable changes in open interest and volume, which often lead to reversals.
When the POIV is making higher highs and/or higher lows and price is making lower highs and/or lower lows, this would represent a bullish divergence and a prospective bullish reversal. Bearish divergences occur when the POIV is making lower highs and/or lower lows and price is making higher highs and/or higher lows. In both cases, trends in open interest and volume would contradict the trend in price.
The easiest way to see these divergences is to overlay the POIV indicator on the price graph using different scales for price and POIV.
Bearish Divergence in Natural Gas
A single indicator should never be used in isolation to make investment decisions. As a result, in the following examples, I also included my custom COT indicator, which is based on the weekly commitment of traders data. If you would like a refresher on applying the COT data, please revisit my earlier post titled "Trade With the Experts."
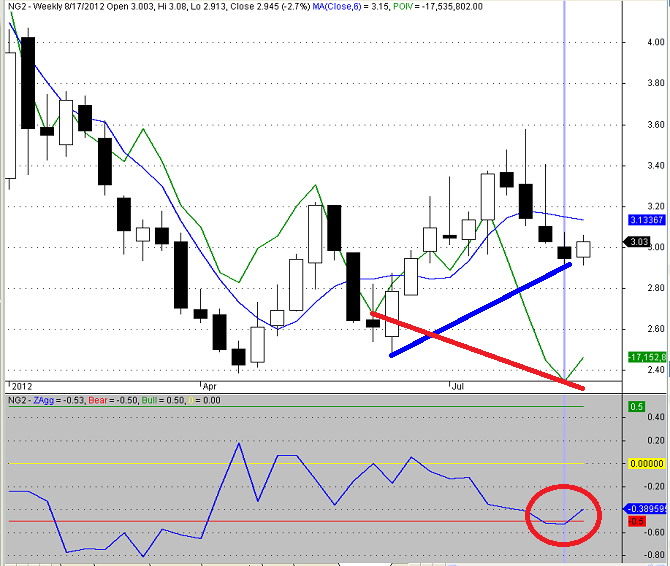
The top panel in Figure 1 below is a weekly candlestick chart of the continuous Natural Gas futures contract through the close on August 22, 2012. A short-term simple moving average is shown in blue. If you are interested in following the actual price level, November 2012 is the current contract in the series. The POIV indicator is included in the top panel in green, using its own scale. The bottom panel of the chart depicts my custom COT indicator in blue. Extreme COT indicator readings are denoted by the horizontal green (bullish) and horizontal red (bearish) lines.
I highlighted the trend divergence between price and the POIV by using heavy blue and red lines. The higher lows in price are illustrated by the upward sloping heavy blue line. During the same period, the POIV was making sharply lower lows (heavy red line), indicating a significant divergence and a possible bearish reversal in the price of Natural Gas.
The recent values of the custom COT indicator (bottom panel in Figure 1) also suggest a potential bearish reversal. Finally, reversal trades should never be implemented until the price trend actually begins to reverse. In this case, the price of the Natural Gas futures contract crossed below its short-term moving average two weeks ago, suggesting a potential trend change.
Bearish Divergence in Wheat
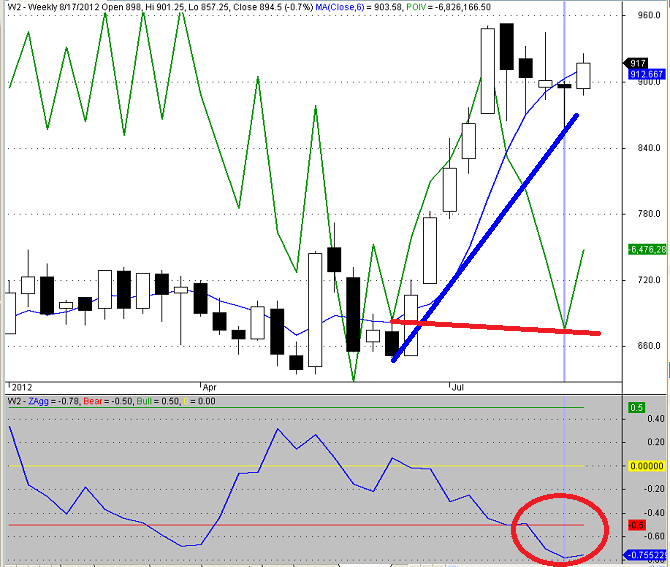
The layout in Figure 2 below is the same as in Figure 1 above, but the underlying continuous futures contract in Figure 2 is Wheat. December 2012 is the current contract in the series.
As I did with the Natural Gas contract, I highlighted the trend divergence between the continuous Wheat contract price and the POIV by using heavy blue and red lines. The sharply higher lows in price are illustrated by the upward sloping heavy blue line. During the same period, the POIV was making lower lows (heavy red line), which indicated a significant divergence and a potential bearish reversal in the price of Wheat.
The recent values of the custom COT indicator (bottom panel in Figure 2) are even more extreme than the COT indicator values for Natural Gas. However, unlike Natural Gas, the price of the continuous Wheat contract (as of yesterday's close on August 22, 2012) was still above its short-term moving average.
As I write this, the current price of the December 2012 Wheat contract is down 2.37% today and is trading at 895, which is currently below the short-term moving average of 912.667. If the Wheat price remains below the moving average, that would suggest a potential trend change and would support the bearish POIV and COT reversal signals.
Conclusion
Larry Williams's POIV indicator is a valuable resource for identifying potential reversals in the futures markets. However, it should not be used in isolation. The COT indicator is one of my favorite tools and can provide an independent source of confirmation for the POIV. Nevertheless, even when both indicators agree, it would be wise to wait for evidence of a trend change before entering reversal trades. Unfortunately, that still does not guarantee success. In all cases, stops should be used to limit losses to a reasonable percentage of total capital.
The above examples are included for educational purposes only and are not investment recommendations or investment advice. Natural Gas and Wheat futures are notoriously volatile contracts and should only be used by experienced futures traders. Please read the full disclaimer for additional information.
As promised, the AMIBroker code for Larry Williams's POIV indicator is included below in Figure 3.
Trader Edge Strategy E-Subscription Now Available: 20% ROR
The Trader Edge Asset Allocation Rotational (AAR) Strategy is a conservative, long-only, asset allocation strategy that rotates monthly among five large asset classes. The AAR strategy has generated 20%+ annual returns over the combined back and forward test period (1/1/1990 to 7/29/2013). Please use the above link to learn more about the AAR strategy.
Feedback
Your comments, feedback, and questions are always welcome and appreciated. Please use the comment section at the bottom of this page or send me an email.
Do you have any questions about the material? What topics would you like to see in the future?
Referrals
If you found the information on www.TraderEdge.Net helpful, please pass along the link to your friends and colleagues or share the link with your social network.
The "Share / Save" button below contains links to all major social networks. If you do not see your social network listed, use the down-arrow to access the entire list of social networking sites.
Thank you for your support.
Brian Johnson
Copyright 2012 - Trading Insights, LLC - All Rights Reserved.


Pingback: Multiple Indicators Point to Market Pullback | Trader Edge
Pingback: Top 10 Trader Edge Articles | Trader Edge