I read about this indicator in an article titled "The DMI Stochastic," which appeared in the January 2013 issue of Technical Analysis of Stocks and Commodities. The article was written by Barbara Star. In the article, Star combined two well-known technical indicators to create an innovative new tool that can be used to identify high-probability reversal candidates.
The following article explains the procedure required to calculate the DMI stochastic (DMISTO) and demonstrates the potential of this new indicator with a sample pullback strategy that achieved a win rate of over 80% (since 2000 - in sample). AMIBroker code for the DMIS is included at the end of the article.
The DMI Stochastic (DMISTO)
In the late 1970s, J. Welles Wilder introduced the Directional Movement Index (DMI), which is made up of two components: the plus directional movement indicator (+DI) and the minus directional movement indicator (-DI). Star subtracts the -DI from the +DI to create an oscillator that reflects both the strength and direction of the recent price trend. Positive values indicate rising prices and negative values signify falling prices.
Star then used the resulting DI oscillator as an input into the standard Stochastic indicator, which normally uses the closing prices of the underlying security. The Stochastic indicator calculates three different values: fast %K, slow %K, and %D. Fast %K is based on the relationship of the current value of the input variable (the DI oscillator in this case) relative to the lowest and highest values of the input variable over a user-specified look-back period. The slow %K is simply a moving average of the fast %K. %D is a moving average of slow %K.
A Sample DMISTO Reversal Strategy
I used AMIBroker to build a simple test strategy to better understand how DMISTO works and how it could be used to add value. DMISTO is an oscillator, so I created a weekly reversal strategy to buy when conditions were oversold and sell when the market was overbought.
To ensure the DMISTO strategy always traded in the same direction as the long-term trend, I used a moving average filter to eliminate long trades when the closing price was below the long-term moving average and prevent short trades when the closing price was above the moving average.
I optimized the strategy based on weekly values of the S&P 500 Index, the Russell 2000 index, and the NASDAQ 100 index from January 2000 to January 2013. Only one trade was permitted at a time and each trade represented 100% of portfolio equity. No stops were used. The purpose of this exercise was a proof-of-concept only. As a result, I did not withhold an out-of-sample data set. While the example below was based on weekly periods, the DMISTO could be used for daily periods as well.
Optimized Parameters:
- User Specified DMI and Stochastic Look-back Periods: 10 weeks
- Stochastic Moving Average Periods for Slow %K and %D: 3 weeks
- Long Entry: (Weekly Slow %K Crosses Above %D) AND (%D < 9)
- Short Entry: (Weekly Slow %K Crosses Below %D) AND (%D > 85)
- Moving Average Filter Period: 27 weeks
- Long Exit: After 7 weeks
- Short Exit: After 5 weeks
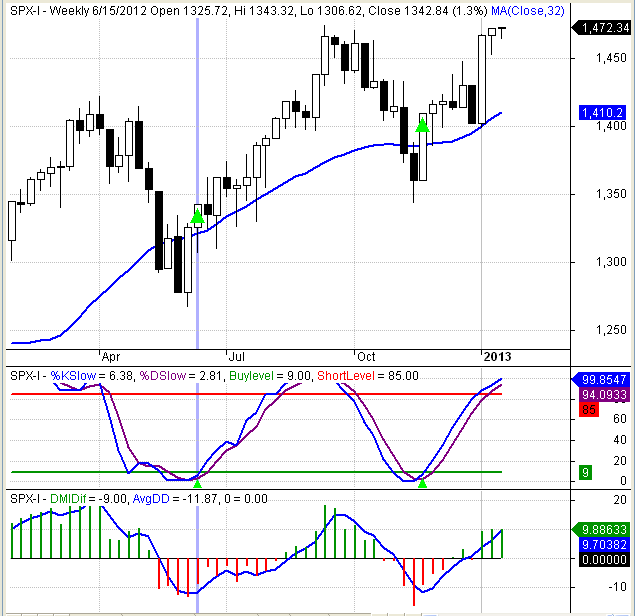
The top panel in Figure 1 below is a weekly candlestick chart of the NASDAQ 100 index (NDX) for approximately the last 12 months. The blue line signifies the 27-week moving average that was used to filter long and short trades.
The middle chart pane illustrates the DMI Stochastic values for slow %K (blue) and %D (purple). The bullish and bearish signal thresholds from the optimized strategy are represented by the green and red horizontal lines, respectively.
The bright green arrows represent prospective buy signals that met all of the strategy criteria. Note: not all of these trades would have been executed. Remember, only one position was permitted at a time and the strategy was tested on three different indices. In addition, trades remained open for multiple weeks. Nevertheless, the prospective signals should help you understand the types of trades executed by the DMISTO reversal strategy.
The DMISTO reversal strategy does not trade frequently, but it does attempt to identify very high probability trades - always entering after pullbacks, but still trading in the same direction as the prevailing trend.
The third panel depicts the DI oscillator (the difference between DI+ and DI-), which was used as an input to the Stochastic (10,3,3). It is interesting that the two long trades above were both executed when the DI oscillator was negative (DI- larger than DI+), but the DI oscillator was increasing.
DMISTO Strategy Results
The optimized DMISTO strategy earned a compound annual return of 10.01%, but was only invested 24.08% of the time. The resulting risk-adjusted annual return was 41.58%. The maximum peak to trough drawdown was 11.92%, which resulted in an attractive CAR/Maximum Drawdown ratio of 0.84.
A remarkable 81.48% of the trades were profitable and the average profit on winning trades was 6.84% versus an average loss of -3.60% on the losing trades. The corresponding profit factor was 6.62; total gains were 6.62 times total losses. The Sharpe ratio was 1.79. The comprehensive strategy statistics are provided in Figure 2 below.
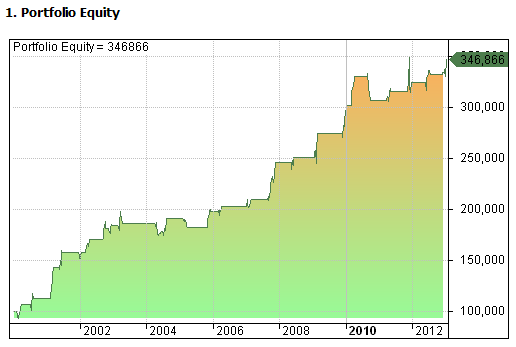
The equity curve is for the sample DMISTO strategy is provided in Figures 3 below.
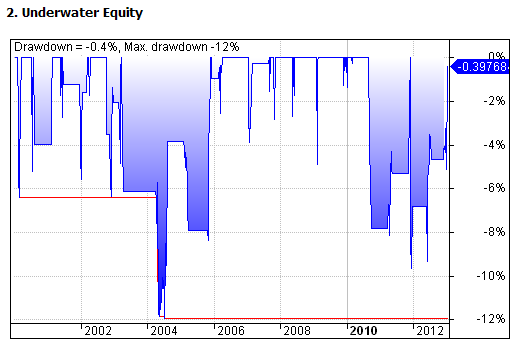
The equity drawdown curve is provided in Figure 4 below. The maximum drawdown was 11.92%, but drawdowns have remained below 10% since 2004.
DMISTO AMIBroker Code
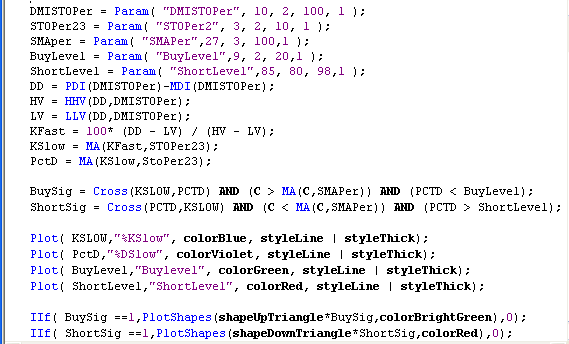
Below is the AMIBroker code for the DMISTO. It is a screenshot from my AMIBroker platform, so you would need to retype the code into your AMIBroker platform if you would like to experiment with the DMISTO. The DMISTO code compiles and runs without error on my platform, so if you encounter any errors, they are probably the result of typos.
Note, the code below is for the DMISTO, not for the DMISTO strategy - although the sample parameters in the code below are the optimized parameters for the strategy.
As always, the DMISTO code and sample strategy are presented for educational purposes only and are not intended as investment advice. I do not consider the DMISTO sample strategy above to be viable in its current form due to the lack of stops, which precludes any means of position sizing or risk management.
Conclusion
Buying pullbacks in the same direction as the long-term trend is a popular approach for systematic traders. These types of strategies typically identify high probability trades and tend to perform well. The DMISTO indicator shows promise for use in these types of systematic trading strategies. While optimized, the strategy results were impressive, especially for only using a single indicator and a simple moving average filter.
Ideally strategies should incorporate several different types of indicators for trade confirmation. In addition, a longer time period (including out of sample data) should also be used when developing strategies. While the above strategy needs additional work, the DMISTO indicator shows promise.
Trader Edge Strategy E-Subscription Now Available: 20% ROR
The Trader Edge Asset Allocation Rotational (AAR) Strategy is a conservative, long-only, asset allocation strategy that rotates monthly among five large asset classes. The AAR strategy has generated 20%+ annual returns over the combined back and forward test period (1/1/1990 to 7/29/2013). Please use the above link to learn more about the AAR strategy.
Feedback
Your comments, feedback, and questions are always welcome and appreciated. Please use the comment section at the bottom of this page or send me an email.
Do you have any questions about the material? What topics would you like to see in the future?
Referrals
If you found the information on www.TraderEdge.Net helpful, please pass along the link to your friends and colleagues or share the link with your social or professional networks.
The "Share / Save" button below contains links to all major social and professional networks. If you do not see your network listed, use the down-arrow to access the entire list of networking sites.
Thank you for your support.
Brian Johnson
Copyright 2013 - Trading Insights, LLC - All Rights Reserved.


The code for DMIDif is missing.
Like your blog. Like it better if one can cutnpaste or download the code.
Regards,
John
John,
Sorry about that – I didn’t notice the DMIDIF function reference in the code. I revised the code and eliminated the DMIDIF function call. I replaced the original AMIBroker code screenshot with one of the new code. Let me know if you encounter any problems with the revised code.
The next time I include AMIBroker code in a post, I will experiment with using text – which should allow readers to copy and past the code directly. Thanks for the suggestion.
Best regards,
Brian Johnson
Thanks Brian! Lookin forward to your next post.
John
I really enjoy your blog, great work! I’m a newbie with Amibroker so it’s always interesting to try out some of your indicators. I would also appreciate the ability to copy/paste the code, I made numerous errors when I keyed the MCVI indicator, I thought I’d never find them al.
Thanks again
Thanks. I am glad that you are finding Trader Edge to be helpful. I will definitely use text (instead of a screenshot) for my next AMIBroker code example.
Best regards,
Brian Johnson
Hi Brian – Nice site. I stumbled onto your site few days back. Lots of interesting posts and plan to investigate some of the ideas further. Thanks.
Best Regards.
Thanks for your comments. Let us know if your further research into some of the post topics looks promising.
Best regards,
Brian Johnson
Thanks for posting this! As for the AmiB code, it has been my experience when using a wordpress platform that if I use the quote function of the editor that I can paste the AmiB code into the quote and it is preserved properly and able to be cut and pasted from the blog. Cheers!
I was concerned that WordPress would not be able to handle the AMIBroker code (or possibly even corrupt it), which is why I used the screen shot image originally. I will try the quote function the next time I provide an AMIBroker code sample. If it works, it will be easier for everyone.
Thanks for the suggestion.
Best regards,
Brian Johnson
Pingback: What I’m Reading This Weekend | System Trading with Woodshedder
Thank you so much for the great article and charts. I tried it in Metastock and found it very helpful.
I could not copy the charts into a word document. Could you do something about it.
Once again thanks.
George,
I was able to copy the charts using the following procedure with the Mozilla Firefox browser:
1) Click on the chart image – this will bring up a separate WordPress page with the image, title, some navigation tools, etc.
2) Click on the image again – this will bring up a new page with only the image (no text, titles, etc.)
3) From the Edit tab, choose select all – this will highlight the image and enable the copy function
4) From the Edit tab, choose copy
5) Paste the image into word (do not use the text only option or you will only paste the link)
I assume there are similar procedures for other browsers.
Please remember that all text and images from the site are copyrighted. If you use the image in a document or on a webpage, please attribute the source to TraderEdge.Net and provide a link back to the site.
Best regards,
Brian Johnson
Thanks for the reply. I found the article very interesting and useful. So I thought I would keep a copy of it for further reading and study.
Thank you.
George
Hi Brian,
I am not familiar with Amibroker codes. Hence this question.
For DMI, what periods have you used? Have you taken the default 14 periods or have you taken some other periods?
In the 3rd panel of the chart, you have plotted the DMI as an oscillator, and you have also plotted a blue line. Is this blue line a moving average of the DMI? If so what period have you used? Is it exponential, simple, or weighted?
A reply would be very much appreciated.
Thanks,
George
George,
I used a 10-week DMI for the sample DMISTO indicator. All of the moving averages used in the sample indicator and sample strategy were simple moving averages.
The blue line in the third panel is a simple moving average of the difference of +DI and -DI. I do not remember the exact number of periods that I used in the DMIDif chart, but this moving average was not used in the sample DMISTO strategy. I only included the third panel to illustrate how the the DMI changes as prices change.
Best regards,
Brian Johnson
thanks for this, very interesting but Im having a hard time getting your results, what did you use as an exit strategy, only an N bar exit?
(weekly trades, 3 ETF/Indices, buy or short on buysig, sellsig)
James,
I used the N-bar exit on the SPX, NDX, and RUT indices. The strategy also exited long positions on a short signal and exited short positions on a long signal. All trades were weekly and the strategy only invested in a single candidate at at time and each trade used 100% of the account.
To run the strategy, you would also need to use a position score to determine which index was used when there were simultaneous signals in multiple indices. If you refer to the sample code, I used a position score equal to 100-DD.
Thank you for your question and for your interest in Trader Edge.
Best regards,
Brian Johnson
Dear Brian Johnson,
I am looking for AFL which can draw MACD/MACD Histogram, CLASSIC and HIDDEN Divergences lines automatically.
Can you help in this matter.
Waiting for your reply.
With Regards
Vishnu Dutt Kaushik
Delhi(India)
Vishnu Dutt Kaushik,
Unfortunately, I have not developed or seen AFL code that can draw classic and hidden divergence lines for the MACD histogram. I am currently working on my second options book and as a result am not able to pursue this project, but I will post a link here if I find a source for the divergence code.
Regards,
Brian Johnson
Dear Sir,
Can I get AFL for MACD and price divergence line plotted on real-time basis on chart.If yes please post it or send on my email id.Waiting for your positive reply.
Regards
Vishnu Dutt Kaushik
Vishnu Dutt Kaushik,
MACD and price divergence lines were not plotted on the chart in this post and I am not currently using that indicator in any of my strategies. If I develop a non-proprietary version of that indicator in the future, I will post the code.
Regards,
Brian Johnson