
This article presents the Trader Edge aggregate neural network model forecast for the August 2015 non-farm payroll data, which is scheduled to be released tomorrow morning at 8:30 AM EDT.
Non-Farm Payroll (NFP) Model Forecast - August 2015
The Trader Edge aggregate NFP model represents the average of three neural network forecasting models, each of which employs a different neural network architecture. Unlike expert systems, neural networks use algorithms to identify and quantify complex relationships between variables based on historical data. All three models derive their forecasts from seven explanatory variables and the changes in those variables over time.
The table in Figure 1 below includes the monthly non-farm payroll data for two months: July and August 2015. The July data was released last month and the non-farm payroll data for August 2015 will be released tomorrow morning at 8:30 AM EDT.
The model forecasts are in the third data row of the table (in blue). Note that past and current forecasts reflect the latest values of the independent variables, which means that forecasts will change when revisions are made to the historical economic data.
The monthly standard error of the model is approximately 77,000 jobs. The first and last data rows of the table report the forecast plus 0.5 standard errors (in green) and the forecast minus 0.5 standard errors (in red), respectively. All values are rounded to the nearest thousand. If the model errors were normally distributed, roughly 31% of the observations would fall below -0.5 standard errors and another 31% of the observations would exceed +0.5 standard errors.
The actual non-farm payroll release for July 2015 is in the second data row of the table (in purple). The consensus estimate (reported by Briefing.com) for August 2015 is also in the second data row of the table (in purple). The reported and consensus NFP values also include the deviation from the forecast NFP (as a multiple of the standard error of the estimate). Finally, the last column of the table includes the estimated changes from July 2015 to August 2015.

Figure 1: Non-Farm Payroll Table August 2015
Model Commentary
The aggregate neural network model forecast for August is 201,000, which is unchanged from last month's revised forecast of 201,000, reflecting no change in the strength of the employment environment during the month of August. The Briefing.com consensus estimate for August is 217,000, which only 2,000 higher than the July NFP data (215,000), also indicating a stable employment environment. The actual July data was slightly above the revised July forecast (+0.18 S.E.) and the consensus estimate for August is also slightly above the model forecast (+0.21 S.E.).
If we ignore the large NFP outliers, there had been a gradual and sustained positive trend in the employment data from mid-2012 through January of 2015. The trend is easier to see in the forecast data due to fewer outliers. The positive trend in the model forecasts definitely leveled off in early 2015 and reversed for several months and continues to be weaker than in 2014.
The difference between the August NFP consensus and August NFP forecast is insignificant and offers no material insights into an upside or downside surprise tomorrow. If the August NFP is consistent with the forecast, it will offer the Fed very little new information for its upcoming interest rate decisions.
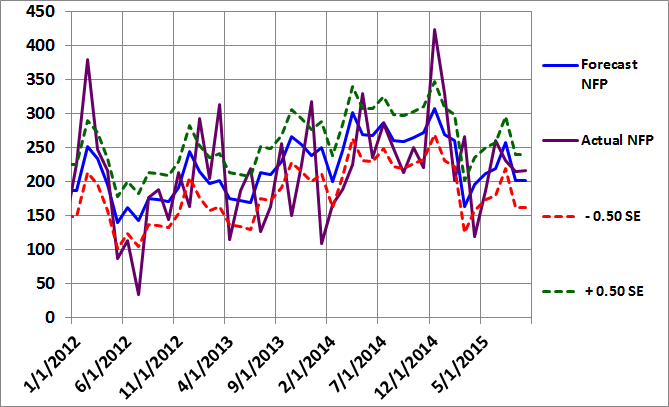
Figure 2: Non-Farm Payroll Graph August 2015
Summary
Basic forecasting tools can help you identify unusual consensus economic estimates, which often lead to substantial surprises and market movements. Identifying such environments in advance may help you protect your portfolio from these corrections and help you determine the optimal entry and exit points for your strategies.
In the case of the NFP data, the monthly report data is highly variable and prone to substantial revisions. As a result, having an independent and unbiased indicator of the health of the U.S. job market is especially important.
Print and Kindle Versions of Brian Johnson's 2nd Book are Available on Amazon (75% 5-Star Reviews)
Print and Kindle Versions of Brian Johnson's 1st Book are Available on Amazon (79% 5-Star Reviews)
Trader Edge Strategy E-Subscription Now Available: 20% ROR
The Trader Edge Asset Allocation Rotational (AAR) Strategy is a conservative, long-only, asset allocation strategy that rotates monthly among five large asset classes. The AAR strategy has generated annual returns of approximately 20% over the combined back and forward test period. Please use the above link to learn more about the AAR strategy.
Brian Johnson
Copyright 2015 - Trading Insights, LLC - All Rights Reserved.


So, it is all good and well showing the prediction after the event, but will you please share the prediction before the next event. Then at least I can try take a position up on it, I am even willing to pay for that kind of info.
Thanks
Stephen,
With one recent (unintentional) exception, I publish the NFP model forecast the Thursday before the report is released – sometime during the regular trading session. As a result, you should have enough time to evaluate the forecast and adjust your positions accordingly. A few months ago, the NFP report came out a day early due to a market holiday on Friday and I failed to get the model forecast out in advance. Other than that, the forecast always comes out before the actual data. Remember, the August data comes out in September, which may be causing confusion.
Best regards,
Brian Johnson
Hi Brian
Thanks for the reply. You are right, I was wrong in saying that you do not give the data out. Next time I will carefully read the article before replying. Thanks for the great work you put out.
I am reading your second book at the moment, I find it quite complex.
Thanks again
Stephen,
The fact that implied volatility is a non-linear weighted average of “normal” and earnings volatility is intuitive, but applying the concept in practice is more challenging. Fortunately, the spreadsheets that accompany the book do all of the calculations. Send me an email if you have any specific questions about the book.
Best regards,
Brian Johnson