At the end of every article, I solicit topic suggestions from readers. The following is recent request from Pete Kasper, which provided the inspiration for this article:
I continue to enjoy your cogent articles week after week. I’d like to respond to your request for topics for future articles. As a retired physicist I tend to favor analysis systems that use statistical backtesting and walk-forward testing. In monitoring price series it is clear that basic technical analysis tools such as support and resistance lines and even trend lines are powerful tools but don’t seem to be adaptable to computerized testing. The proposed topic then is “How to work with support, resistance and trend lines in an otherwise back testing system."
I agree with Pete that trendlines are very powerful tools; unfortunately, they are notoriously difficult to program for use in systematic strategies. I use trendlines regularly, but have always drawn them by hand. I have thought about automating this process before, but it never made it to the top of my project list - until now. Pete's request gave me the incentive to do some preliminary work on the topic.
I recently posted an article titled "How to Draw Trendlines & Avoid Severe Losses." In that article, I provide a set of objective, unambiguous rules for drawing trendlines. The following article explains how to use those rules to generate trendlines on all of your charts. Automatically. The AMIBroker code segments used to generate automated support and resistance lines are provided at the end of this article.
Trendline Construction
If you would like a more comprehensive explanation of the rules used for trendline construction, including detailed examples, please review the original trendline article "How to Draw Trendlines & Avoid Severe Losses." The following section is from the original trendline article and provides a brief summary of the trendline construction rules.
The purpose of trendlines is to identify areas of support and resistance, which allows us to know when those areas have been violated, which helps us identify changes in the trend. A bullish trendline is an upward-sloping line connecting two (or more) lows. It lies below the price action, providing an area of support. A bearish trendline is a downward-sloping line connecting two (or more) highs. It rests above the price action, acting as an area of resistance to higher prices.
Unfortunately, the descriptions above are too general for constructing a specific trendline. We need a set of objective rules to determine which highs and which lows to use when creating our trendlines. Below are the rules for drawing bullish support lines.
- Choose the major low that marked the beginning of the bullish trend for your desired time horizon (long-term, intermediate-term, etc.) - this is Point #1.
- Moving to the right, identify the highest high that occurred after Point #1 - this is Point #2.
- Identify the low between Points #1 and #2 that generates the shallowest slope from Point #1 - this is Point #3.
- Draw a ray that originates at Point #1 and passes through Point #3.
The rules for drawing bearish resistance lines are simply the reverse of the rules for drawing bullish support lines.
- Choose the major high that marked the beginning of the bearish trend for your desired time horizon (long-term, intermediate-term, etc.) - this is Point #1.
- Moving to the right, identify the lowest low that occurred after Point #1 - this is Point #2.
- Identify the high between Points #1 and #2 that generates the shallowest slope from Point #1 - this is Point #3.
- Draw a ray that originates at Point #1 and passes through Point #3.
Automated Trendline Examples
The preceding rules were intended for drawing trendlines manually. As a result, they allowed users to select their desired time horizons, which were used to identify the beginning date for each trendline. Unfortunately, computer programs do not make discretionary decisions; they require objective algorithms.
Steps two through four above are objective and unambiguous. However, to automate trendline construction I needed to provide a specific rule for identifying the origin of the trendline. For support lines, I used the lowest low within the user-specified look-back period. For resistance lines, I used the highest high. I will discuss the implications of these rules later in the article. For now, let's proceed with two examples.
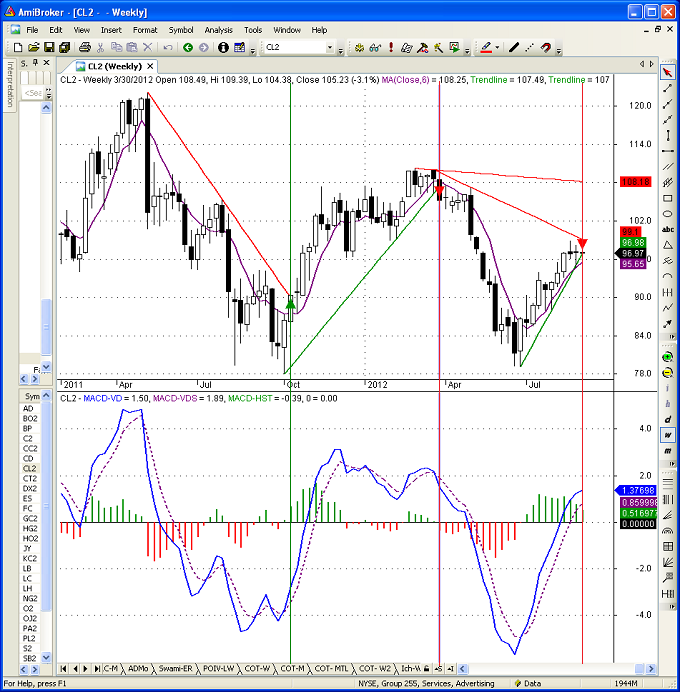
Figure 1 below is a weekly chart of the continuous crude oil futures contract through September 7, 2012. The top panel includes a candlestick chart and automated support (green) and resistance (red) lines for three time periods: 26 weeks, 52 weeks, and 78 weeks. The top panel also includes a simple six-week moving average line (violet).
In addition to the trendlines, the top panel also includes trendline break symbols. There are many ways to define trendline breaks. In these examples, a trendline break would be a weekly close or crossover below a support line (bearish signal - downward red triangle) or a weekly close or crossover above a resistance line (bullish signal - upward green triangle).
While trendlines are powerful, I never like to rely on individual indicators, even in examples. As a result, I added the MACD indicator and MACD histogram in the second panel. However, I cut the standard MACD period parameters in half to make them more responsive.
The solid blue line in the second panel is the MACD line and the dashed violet line is the MACD signal line. For example purposes only, we will interpret a MACD line above the signal line as bullish confirmation and a MACD line below the signal line as confirmation of a bearish trend.
The trendlines depicted below and the trendline break signals were all generated automatically using the sample AMIBroker code provided at the end of the article. I also added three vertical lines manually to help you identify the one bullish and two bearish trendline breaks on the chart.
Notice the bullish trendline break and the first bearish trendline break were confirmed by the six-week moving average and by the MACD. In other words, for the bullish trendline break (upward green triangle), the weekly closing price was above the six-week moving average on the date of the trendline break. In addition, the solid blue MACD line was above the dashed violet signal line on the same date. The first bearish trendline break (downward red triangle) was also confirmed by the moving average and by the MACD.
Now take a look at the second bearish trendline break on the far right-hand side of the crude oil chart. Notice that the weekly closing price was still above the six-week moving average AND the MACD line was still above the MACD signal line on the date of the break. This bearish signal was not confirmed.
My custom commitment of traders (COT) indicator for crude oil (not shown) was bearish as well, but the level was not sufficiently extreme to confirm a bearish trade. While crude oil prices may in fact reverse direction, it is always prudent to use multiple indicators to confirm trading signals.
In addition, shorting crude oil always makes me nervous, especially in light of the escalating tensions between Israel and Iran. In this environment, vertical debit spreads with fixed maximum losses might be safer vehicles for bearish positions in crude oil, heading oil, and gasoline than short futures positions.
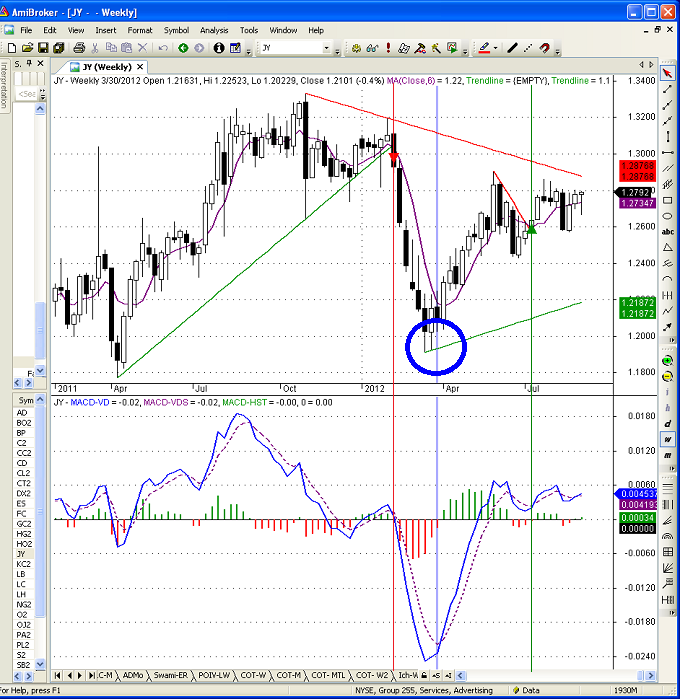
Figure 2 below is a weekly chart of the Japanese Yen continuous futures contract through September 7, 2012. The format and parameters used are the same as those in Figure 1 above. There were only two trendline breaks on the Japanese Yen chart below: one bullish and one bearish.
The bearish trendline break below (downward red triangle) was confirmed by both the moving average and by the MACD. This trade would have performed remarkably well. The bullish trendline break (upward green triangle) was confirmed by the moving average, but not by the MACD (although this is very difficult to see due to the scale of the chart).
Practical Considerations and Limitations
At this stage, the code used to generate the automated trendlines is little more than a functional prototype used to demonstrate a proof of concept. Much more work would be required before using the code in an investment process. However, the initial results are very encouraging and I wanted to respond to Pete's topic request in a timely fashion.
There are two main issues outstanding. First, I am not happy with the rule used to define the starting date of the trendline. Using the date of the lowest low or the highest high is logical, but that date does not necessarily signify the beginning of the trend.
In Figure 2 above, notice that the support line begins at the bar with the lowest low (inside the blue circle). Unfortunately, the shallowest slope used to determine the trend is determined by the very next bar. While this is consistent with the rules, I would not use this specific trendline in practice.
Instead, I would have started the trendline one bar to the right. The resulting trendline would have been a much better reflection of the uptrend. In addition, it would never be appropriate to extrapolate the slope of adjacent lows (or highs) into the future to define support or resistance lines. Determining the optimal starting point for a trendline is easy to do visually on a case-by-case basis, but more challenging to describe and program as an algorithm. Nevertheless, the current rule should be modified to select more appropriate starting points.
The second drawback is that the current code only generates trendlines (and trendline break signals) looking backward from today. It does not generate all trendlines and signals that would have existed historically, which currently precludes backtesting. Obviously strategy development and backtesting were Pete's ultimate objectives when he requested this topic (they are my ultimate objectives as well). Nevertheless, the initial code is a step in the right direction and could be modified for use in systematic strategies.
Even as a prototype, the current code could be used to generate multiple trendlines automatically for a range of look-back periods. In addition, it would be straightforward to modify the current code to scan a large number of prospects for trendline breaks or for trend direction based on the location of the closing price relative to the support and resistance lines.
AMIBroker Code
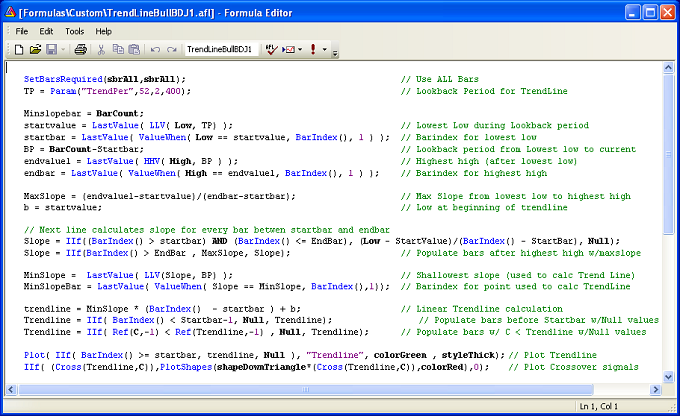
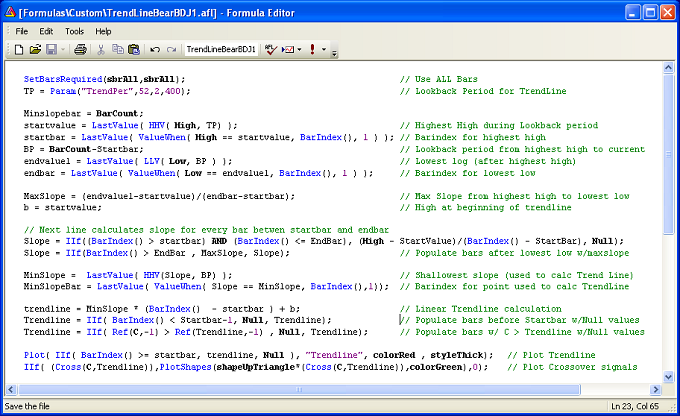
The following two AMIBroker code samples were used to generate the automated support and resistance lines in the previous examples. Both are prototypes that require further work. The code samples are provided for educational purposes only. Please read the Disclaimer and Terms for more information.
The images below are screen shots from AMIBroker. As a result, you will need to type the code into your AMIBroker software manually; typos will cause compile or run-time errors. The code below compiles and runs without errors on my machine.
Conclusion
Eventually, automated trendline breaks could be used to generate systematic trading signals and the resulting trendlines could also be used to confirm signals from other systems. For now, it is amazing to be able to scroll from chart to chart and from period to period without having to manually draw the trendlines. Pete, thanks again for the topic suggestion; I hope you find the initial work on automated trendlines to be helpful.
Trader Edge Strategy E-Subscription Now Available: 20% ROR
The Trader Edge Asset Allocation Rotational (AAR) Strategy is a conservative, long-only, asset allocation strategy that rotates monthly among five large asset classes. The AAR strategy has generated 20%+ annual returns over the combined back and forward test period (1/1/1990 to 7/29/2013). Please use the above link to learn more about the AAR strategy.
Feedback
Your comments, feedback, and questions are always welcome and appreciated. Please use the comment section at the bottom of this page or send me an email.
Do you have any questions about the material? What topics would you like to see in the future?
Referrals
If you found the information on www.TraderEdge.Net helpful, please pass along the link to your friends and colleagues or share the link with your social network.
The "Share / Save" button below contains links to all major social networks. If you do not see your social network listed, use the down-arrow to access the entire list of social networking sites.
Thank you for your support.
Brian Johnson
Copyright 2012 - Trading Insights, LLC - All Rights Reserved.


I am just a beginner past and your article on trend line has given me a leap into much higher levels of understanding the market movements. Thks
Rajasekhar,
Thanks for your comments. I am glad that you found the trendline article interesting. Trendlines are a simple tool, but then can provide significant insight into market direction.
Best regards,
Brian Johnson
Brain,
First of all Thanks for sharing the great code, it is very helpful. I have been using amibroker for the last 5 years. I couldn’t find any free or paid automated trendline and patterns code for amibroker. I personally use finviz to screen on patterns and use amibroker for the rest of the analysis. if you ever wrote patterns recognition code please do share.
Appreciate your post.
Thanks
Ravi
Ravi,
Thanks. I am glad that you found the trendline code to be useful.
Trendlines are great tools and the sample code is a good start. As I explained before, the code still requires some improvements to automatically adjust the starting point of the trendline in certain circumstances. Unfortunately, I have not had time to revisit the code – too many ideas for new projects and not enough hours in the day.
The only product that I have seen with a chart pattern recognition module is Nirvana’s OmniTrader. Their module can be used graphically and in strategies.
Best regards,
Brian Johnson
Thanks Brain, I will check their website.
Ravi
First of all Thanks for sharing the great code, it is very helpful.
But Mr.Brain Trendlinebearbdj1.afl is not plotting trendline
Trendlinebullbdj1.afl is working fine
my amibroker version is 5.60
Jagadish,
I am glad that you are finding the code helpful. The bull and bear trendlines are working in my charts. If the bull trendline is working and the bear trendline is not working, I expect the security you are plotting is in a strong uptrend and near the highs, in which case there would be no viable bear trendline.
I suggest plotting a security that is in a downtrend and seeing if the bear trendlines are plotted. You might also try changing the period used to construct the trendline.
Best regards,
Brian Johnson
mr.brain thank you for your response
sir i cheked on all nse futures (india) currently market is in downtrend , i checked in all time frames also
tried changing the period used to construct the trendline.
nothing happened .
i am posting the code what iam using pls do any corrections required
_SECTION_BEGIN(“bearresi”);
SetBarsRequired(sbrAll,sbrAll);
Tp=Param(“Trendper”,52,2,400);
minslopebar=BarCount;
startvalue=LastValue(HHV(High,TP));
startbar=LastValue(ValueWhen(High == startvalue, BarIndex() , 1));
Bp=BarCount-startbar;
endvalue1=LastValue(HHV(High,Bp));
endbar=LastValue(ValueWhen(High==endvalue1,BarIndex(),1));
maxslope=(endvalue1-startvalue)/(endbar-startbar);
b=startvalue;
slope= IIf ((BarIndex()> startbar) AND (BarIndex() endbar, maxslope, slope);
minslope=LastValue(HHV(slope,bp));
minslopebar=LastValue(ValueWhen(slope == minslope,BarIndex(),1));
trendline = minslope * (BarIndex() -startbar) + b ;
trendline = IIf(BarIndex() < startbar-1 , Null , trendline);
trendline = IIf(Ref(C,-1) = startbar, trendline,Null) , “Trendline” , colorGreen,styleThick);
IIf(Cross(trendline,C),PlotShapes(shapeDownTriangle * (Cross(trendline,C)),colorRed),0);
_SECTION_END();
jagadish,
I looked at your code and I found two lines that were not the same as the sample code from the article (there could be more). The two lines after “Bp=BarCount-startbar;” below should reference the LLV not the HHV and should also reference the low, not the high.
endvalue1=LastValue(HHV(High,Bp));
endbar=LastValue(ValueWhen(High==endvalue1,BarIndex(),1));
Unfortunately, WordPress corrupts actual code when pasted into articles, so code screenshots are the only way I have found to include code in posts. The code in the article works in my version of Amibroker, so if you check your code for typographical errors, it should work.
Good luck,
Brian Johnson