With the daily deluge of new data, it is easy to lose the forest for the trees. When in doubt, focus on earnings, the ultimate driver of stock prices. If I could choose one statistic to know in advance, it would be earnings. The recent deterioration in earnings growth estimates coupled with equity prices near all-time highs should set the stage for an interesting month.
Earnings and Equity Prices Diverge
FactSet is a leading vendor of market analytics, financial and market data, financial screening tools, and customized solutions. They also provide a comprehensive, detailed analysis of earnings and earnings trends, which they offer via free weekly PDF files on their site.
Here are some key observations from the latest FactSet report dated October 5, 2012:
"Earnings Growth: The estimated earnings growth rate for Q3 2012 is -2.7%. If -2.7% is the final growth rate for the quarter, it will mark the end of the eleven-quarter streak of earnings growth for the index.
Earnings Guidance: For Q3 2012, 80 companies have issued negative EPS guidance and 23 companies have issued positive EPS guidance. If 78% (80 out of 103) is the final percentage of companies issuing negative EPS guidance for the quarter, it will be the highest percentage recorded by FactSet.
Growth Rebound: Since the start of the third quarter (June 30), analysts have reduced earnings growth expectations for Q4 2012 (to 9.5% from 13.8%), Q1 2013 (to 5.2% from 7.3%), and Q2 2012 (to 9.2% from 14.2%). Despite the reductions to earnings estimates for Q4 2012, analysts are still calling for near double-digit growth (9.5%) for the quarter."
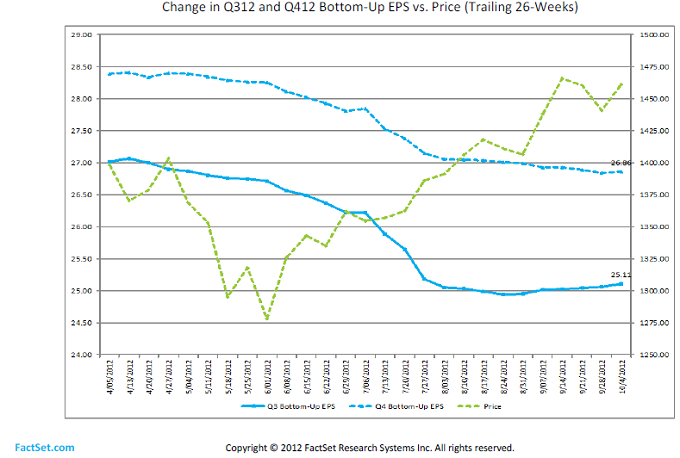
Let's start with the last observation first: analysts have reduced their Q4 earnings growth estimates from 13.8% to 9.5% since June 30, 2012 (all FactSet growth numbers are expressed as year-over-year changes). This deteriorating trend in earnings estimates is obvious from the slopes of the blue lines in the FactSet graph in Figure 1 below.
Despite the negative trend in Q3 2012 earnings estimates, the same analysts are still expecting Q4 2012 earnings to grow by 9.5%. Given the latest Q3 year-over-year growth estimate of -2.7% (which would break an 11-quarter streak of positive earnings growth), Q4 growth of +9.5% seems remarkably optimistic.
In addition, as FactSet noted above, the percentage of companies issuing negative guidance in Q3 is currently 78%, which would be the highest percentage every recorded by FactSet. This is a very bad sign for the market. So how did the market respond to this news? It rallied of course (green dashed line in Figure 1 below).
The divergence between equity prices and earnings is even more alarming when analyzed over the past year. The S&P 500 index opened at 1131.2 on October 3, 2011, shortly before the beginning of Q3 2011 earnings season. One year later, on October 5, 2012, the S&P 500 index closed at 1460.93, which represents an increase of 29.15%.
On the surface, a one-year return of 29.15% might not seem unreasonable, until you remember that the current estimate of Q3 2012 earnings is 2.7% less than Q3 2011 earnings. That's right. Earnings estimates are down 2.7% and prices are up 29.15%!
Prices and earnings will not diverge indefinitely. Either the negative earnings growth trend must reverse direction (as analysts are clearly expecting), or prices must correct (or both).
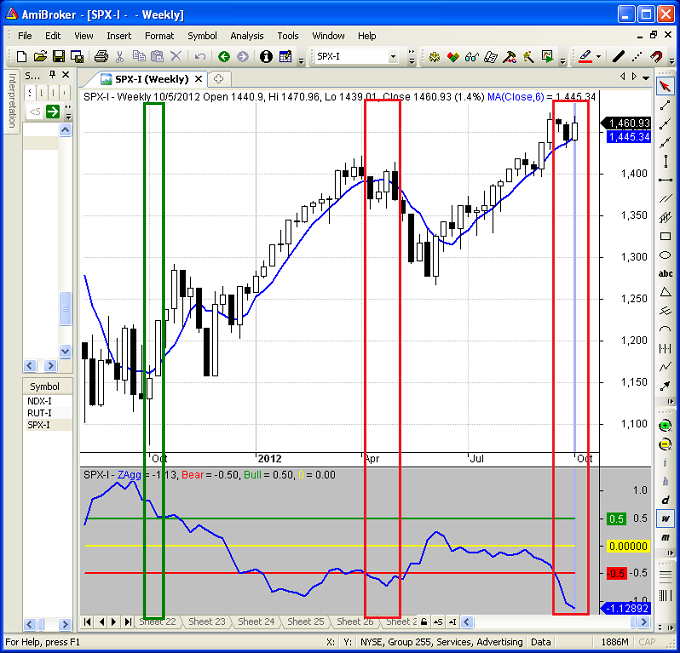
The top panel in Figure 2 below is a weekly (AmiBroker) candlestick chart of the S&P 500 index. The blue line is a six-week simple moving average, which can be used to help identify the trend. The bottom panel is my custom COT (commitment of traders) index (in blue) with horizontal bullish (green) and bearish (red) extreme levels noted on the chart.
The COT indicator is currently well below the bearish extreme, signifying a likely bearish reversal. However, the COT indicator is typically early. Consequently, changes in the price trend should always be confirmed before establishing reversal positions.
As of now, the upward trend is still intact, but a close below the moving average or a break in the trendline would be cause for serious concern, especially given the divergence between earnings growth and equity prices noted above.
Conclusion
The S&P 500 is riding an 18-week uptrend without a significant pull-back. The market is seriously overbought and there is a glaring divergence between equity prices and earnings growth. In addition, my custom COT indicator is extremely bearish, signifying that the commercials are selling into this rally and are continuing to increase their short positions as prices move higher.
The alternative view is that the reduced Q3 earnings estimates are conservative and therefore should be easy to beat. That may or may not be the case, but it is a plausible argument - at least in the near term. However, any additional negative guidance would adversely affect the inflated Q4 earnings growth estimates, which would lead to lower equity prices.
Worldwide quantitative easing programs by central banks have fueled this rally, but eventually prices and earnings must converge. Nevertheless, it is never advisable to short a bull market. It is much more prudent to wait for the price trend to reverse before establishing short positions.
Feedback
Your comments, feedback, and questions are always welcome and appreciated. Please use the comment section at the bottom of this page or send me an email.
Do you have any questions about the material? What topics would you like to see in the future
Referrals
If you found the information on www.TraderEdge.Net helpful, please pass along the link to your friends and colleagues or share the link with your social or professional networks.
The "Share / Save" button below contains links to all major social and professional networks. If you do not see your network listed, use the down-arrow to access the entire list of networking sites.
Thank you for your support.
Brian Johnson
Copyright 2012 - Trading Insights, LLC - All Rights Reserved.


Pingback: Extreme Divergence: Earnings and Equity Prices | Trader Edge
Pingback: Q4 1012 Earnings Preview | Trader Edge