
Adding to losing positions is a sucker's game and playing this game continues to bankrupt an ever-expanding group of traders and investment managers. As a rule, traders should never add to losing positions. However, there are exceptions to every rule. This article introduces a framework for adding to losing positions safely, allowing you to enhance returns without increasing risk. The secret is variable position sizing.
Position Sizing Review
Before exploring the framework for adding to losing positions, a brief review of position sizing is necessary. If you would like a more comprehensive review, please revisit "Stop Loss Orders are Not Enough." Position sizing is a risk management technique that ensures the loss from any trade will not exceed a specified percentage of your total capital.
The position size represents the percentage of your total capital invested in the position. To calculate the position size, first determine the maximum percentage of your total capital you would be willing to lose if you were stopped out on the trade; let's assume 1%. Next, set the stop loss level based on the volatility of the security you are purchasing (or shorting); we will assume a 10% stop. The total capital at risk (1%) divided by the stop loss percentage (10%) equals the maximum position size (10%). In this case, if you lose 10% on a 10% position, you would lose 1% of your total capital (10% x 10%).
Position Sizing Formula
PS = TCAR / SL
PS = 1% / 10% = 10%
- TCAR = Total Capital at Risk: the percentage of your total capital that you would lose by exiting at the stop level
- SL = Stop Loss Percentage Loss: percentage loss on the trade if you exit the trade for the maximum loss at the stop level
- PS = Position Size expressed as a percentage of total capital: the market value of the position divided by the total market value of your portfolio
Doubling Down
Adding to losing positions is psychologically appealing; if we liked it at $100, we would love to buy more at $90, $80, $70.... Unfortunately, it is easy to see how losses could quickly get out of control and jeopardize our entire portfolio. However, there is a way to add to losing positions safely, but we must plan ahead and we must follow our plan - no exceptions.
We will look at four different sets of strategy rules. In the first strategy, we will make an initial purchase, but will not add to our position. In the second case, we will make an initial purchase, but would also buy the same number of shares again if the stock declines by 2.5%. The third scenario is the same as the second, but we would make a third purchase if the stock declines by a total of 5.0%. Finally, in the fourth case we would buy a fourth position if the stock declines by 7.5%. In all strategies, the stop loss level for all trades will be set at -10% relative to the initial purchase price of the first purchase. The maximum number of purchases in the four scenarios are one, two, three, and four respectively.
We will use the following assumptions for all sample calculations:
- Portfolio Value: $100,000
- Initial stock purchase price: $10.00
- Stop loss (SL): -10% (or $9.00)
- Total capital at risk (TCAR): 1%
The table in Figure 1 below summarizes the position size calculations for the four strategies. The first strategy does not add to losing positions, so the position size calculations are the same as those illustrated in the position size formula example above. A 10% loss on a 10% position would limit losses to 1% of total capital. For a $100,000 portfolio, your 10% position would equate to $10,000. To create this position, you would need to purchase 1000 shares at $10.00.
The other three strategies all add to losing positions, which complicates the calculations, but the goal is the same: we want to ensure that the maximum total capital at risk is 1%. To calculate the position size, we must first determine the maximum loss for the remaining three strategies. To make the calculations easier, all percentages will be expressed relative to the original purchase at $10.
The second strategy makes an initial purchase at $10, but would also make a second purchase if the stock declines by 2.5% to $9.75. Even if the stock declines further, the second strategy would not make any additional purchases. It is restricted to one incremental purchase. Given these rules, we can now calculate the total percentage loss for the second strategy. If the stock ultimately declines from $10.00 to $9.00 (-10%) we would be stopped out on both trades: -10% for the initial purchase and -7.5% for the second purchase (remember: all percentages are expressed relative to the original purchase at $10). The total loss would be 17.5% (10% + 7.5%) - see row 5 in Figure 1 below.
Now that we know the maximum percentage loss for the second strategy, we can calculate the position size using our original position size formula.
PS = TCAR / SL
PS = 1% / 17.5% = 5.7% (rounded)
A 17.5% loss on a 5.7% position would limit losses to 1% of total capital. For a $100,000 portfolio, the initial 5.7% position would equate to $5,714. To create this position, you would need to purchase 571.43 shares at $10.00. However, if the stock declined by 2.5%, you would purchase a second 571.43 shares at $9.75. The maximum total loss on both purchases would be $1,000 or 1% of your total capital.
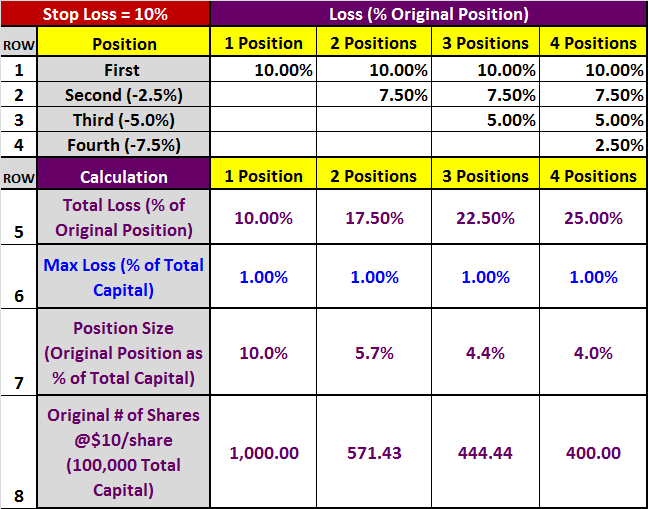
Figure 1: Double Down Strategy Table 1
Let's do one more example: the four position strategy in the far right column. The fourth strategy makes an initial purchase at $10, a second purchase if the stock declines by 2.5% to $9.75, a third purchase if the stock declines by 5.0% to $9.50, and a fourth purchase if the stock declines by 7.5% to $9.25. The fourth strategy is restricted to four purchases, the original purchase at $10.00 and three incremental purchases.
Given these rules, we can calculate the total percentage loss for the fourth strategy. If the stock ultimately declines from $10.00 to $9.00 (-10%) we would be stopped out on all four trades: -10% for the initial purchase, -7.5% for the second purchase, -5.0% for the third purchase, and -2.5% for the fourth purchase (again, all percentages are expressed relative to the original purchase at $10). The total loss would be 25.0% (10% + 7.5% + 5.0% + 2.5%) - see row 5 in Figure 1 above.
Now that we know the maximum percentage loss for the fourth strategy, we can calculate the position size using our original position size formula.
PS = TCAR / SL
PS = 1% / 25.0% = 4.0%
A 25.0% loss on a 4.0% position would limit losses to 1% of total capital. For a $100,000 portfolio, the initial 4.0% position would equate to $4,000. To create this position, you would need to purchase 400 shares at $10.00. If the stock continued to decline, you would purchase a second 400 shares at $9.75, a third 400 shares at $9.50, and the final 400 shares at $9.25. By design, the maximum combined loss on all four purchases would be $1,000 or 1% of your total capital.
Doubling Down to Enhancing Returns
It is rare to buy at the low tick. Invariably, trades go against us for some period of time. Depending on the strategy and on the underlying instrument, it can be advantageous to add to our positions after prices move against us. Let's continue the four strategy example above and examine the profitability of each strategy given a 15% gain in the underlying security (from $10 to $11.5). However, let's also assume that the security declined by 7.5% (or $0.75) prior to achieving that gain.
As was the case before, the first strategy only makes a single purchase, so the results are obvious. The first strategy earned a return of 15% on a 10% position. The resulting return on total capital was 1.5% (10% position x 15% gain) or $1,500 (1000 shares x $1.5 profit per share).
Let's jump to the four position strategy. As explained above, the fourth strategy makes an initial purchase at $10, a second purchase when the stock declines by 2.5% to $9.75, a third purchase when the stock declines by 5.0% to $9.50, and a fourth purchase when the stock declines by 7.5% to $9.25. We assumed the stock declined $9.25 before rebounding to $11.5, so the strategy made all four purchases.
In this scenario, what were the returns? The first purchase earned 15%, the second earned 17.5%, the third earned 20%, and the fourth earned 22.5% (again, all percentages are expressed relative to the original purchase at $10). The resulting total return would have been 75% (15% + 17.5% + 20.0% + 22.5%). This is outstanding, but remember that we had to reduce our initial position size from 10% to 4% due to the larger potential loss. The return on total capital was 3.0% (4% position x 75% gain). In this specific scenario, the four position (3%) strategy doubled the return of the one position strategy (1.5%) - with the same total capital at risk (1%). The scenario results for all four strategies are presented in Figure 2 below.
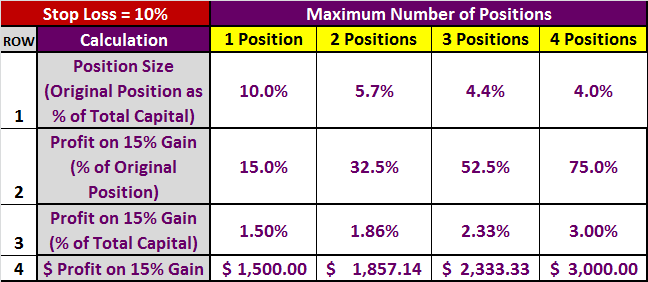
Figure 2: Double Down Strategy Table 2
Practical Considerations
I developed this framework to calculate position sizes for one of my long-only reversal strategies that buys equity index futures on the S&P 500, the Russell 2000, or the NASDAQ 100. The strategy buys on pullbacks, but only in a confirmed uptrend. Adverse price moves make additional purchases more attractive, but only up to a point. At some point, we must acknowledge that if a pullback becomes large enough, it could become a trend reversal and we would need to cut our losses. Hence the need for the stop.
Adding to losing positions in this strategy is particularly attractive because it is a very high probability strategy, but frequently suffers small interim losses, which create excellent add-on opportunities. In addition, since all trades are executed using futures, the overnight gap risk is extremely small and the contracts are highly liquid. Equity index futures trade overnight (except from Friday evening to Sunday evening), which significantly increases the probability of exiting very near the stop level. Remember, the above calculations all assume that we exit at the stop level. If the market gaps overnight beyond the stop level, the total loss could significantly exceed the specified total capital at risk. As a result, minimizing gap risk is critical when using this approach.
Finally, equity indexes are not exposed to company specific risk (earnings, product announcements, litigation, etc.). I would not be comfortable using the above approach to trade individual stocks due to the specific risk and given the overnight gap risk. The above approach is best suited to liquid futures markets that trade overnight.
Summary
Adding to losing positions increases the maximum potential loss. As a result, the position size must be reduced accordingly to maintain the same level of risk. The calculations presented in this article are straightforward, but the number of incremental purchases, the purchase levels, and the stop level must be determined in advance. These same rules must then be used to manage the position. For certain types of strategies on appropriate underlying instruments, this framework could enhance your returns without increasing your risk.
Trader Edge Strategy E-Subscription Now Available: 20% ROR
The Trader Edge Asset Allocation Rotational (AAR) Strategy is a conservative, long-only, asset allocation strategy that rotates monthly among five large asset classes. The AAR strategy has generated 20%+ annual returns over the combined back and forward test period (1/1/1990 to 7/29/2013). Please use the above link to learn more about the AAR strategy.
Feedback
Your comments, feedback, and questions are always welcome and appreciated. Please use the comment section at the bottom of this page or send me an email.
Referrals
If you found the information on www.TraderEdge.Net helpful, please pass along the link to your friends and colleagues or share the link with your social or professional networks.
The "Share / Save" button below contains links to all major social and professional networks. If you do not see your network listed, use the down-arrow to access the entire list of networking sites.
Thank you for your support.
Brian Johnson
Copyright 2013 - Trading Insights, LLC - All Rights Reserved.


Pingback: Pyrimid Trading: Enhancing Returns without Increasing Risk | Trader Edge