
The relative strength market timing indicator (RSMTI) is one of my favorite tools. It has been very useful in identifying short-term and long-term market turning points before they occur. It correctly predicted the recent pullback in the equity markets eight days before the market peaked in January of 2014.
Despite the surprising strength of the equity market over the last seven trading days ending 2/14/2014, the RSMTI is still bearish. That is very unusual and represents a major divergence between prices and relative strength. The recent rebound in equity prices was not supported by relative strength, which is a near-term warning sign for the equity markets.
Relative Strength Market Timing Indicator (RSMTI)
In a 2012 post titled "Market Timing with Relative Strength Revisited," I introduced a market timing indicator based on the relative strength of multiple bullish and bearish security pairs. The approach was based on the article "Applying The Sector Rotation Model," written by Giorgos E. Siligardos. The Siligardos article appeared in the August 2012 issue of Technical Analysis of Stocks and Commodities (TASC).
My 2012 post was comprehensive and explained all of the steps required to create and program the relative strength market timing indicator (RSMTI) using three pairs of bullish and bearish securities. As a result, I will not review the procedure again in this article. However, for your convenience, I included the AMIBroker code for the indicator again at the end of this article. If you missed the original piece, I encourage you to read it in detail. It was one of the most popular articles on Trader Edge.
For those of you who have not read the original post, the RSMTI calculates the cumulative return differences between multiple bullish and bearish security pairs over time. Changes in market direction are often revealed through the relative performance of these security pairs before they become evident in the equity markets. The RSMTI in the original article included three security pairs, but the examples below use a custom version of the RSMTI with six security pairs.
Long-Term Timing with Relative Strength
Before evaluating the current market environment, I wanted to demonstrate that the relative strength indicator can also be used to identify long-term market turning points. When used for this purpose, the indicator should be applied to weekly charts, to eliminate the noise in daily charts that often obscures long-term signals.
The top panel in Figure 1 below is a weekly candlestick chart of the Russell 2000 index (RUT) from late 2007 to early 2014. The pink shaded regions in the chart correspond to bearish or cautionary periods when the relative strength market timing indicator (RSMTI) was below its 21-week moving average. The blue line in the bottom panel of the chart depicts the weekly values for the RSMTI. The red and green histogram bars represent the daily changes in the relative strength timing indicator. Finally, the purple line represents the 21-week moving average of the relative strength timing indicator.
The bearish signals from the relative strength timing indicator often precede market turning points, even though the signal was generated by a 21-week moving average crossover, which usually lags the market significantly. This illustrates how timely relative strength signals can be in practice.
The RSMTI correctly identified the perilous market crash during the great recession of 2007 and 2008, yet turned bullish in early 2009. The RSMTI also identified the significant corrections in 2010 and 2011 before they occurred, as well as several other minor pullbacks.
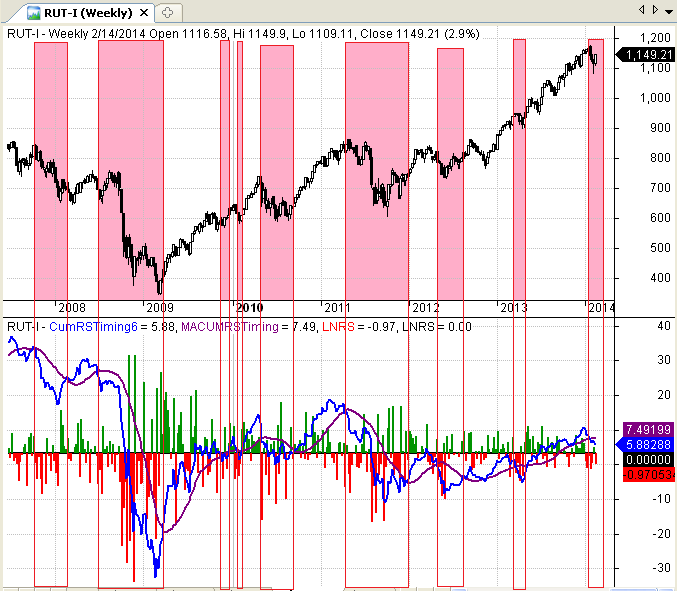
Figure 1: RUT RS Weekly 2008-2014
Short-Term Timing with Relative Strength
The RSMTI can also be used to identify short-term changes in market direction. However, the indicator should be calculated on daily charts when attempting to forecast short-term reversals.
The top panel in Figure 2 below is a daily candlestick chart of the Russell 2000 index (RUT) from mid-November 2013 to 2/14/2014. The pink shaded regions in the chart correspond to bearish or cautionary periods when the relative strength timing indicator was below its 21-day moving average. The format of the bottom panel is the same as Figure 1, except that daily data were used in the calculation.
As you can see in Figure 2, the RSMTI peaked well before RUT and the bearish crossover signal was generated eight trading days before RUT peaked. Unfortunately, while the RUT has rebounded sharply over the past seven trading days, the RSMTI is still bearish. Not only that, but the slope of the RSMTI is still negative, as is the slope of its 21-day moving average. This is very troubling and suggests that the recent pullback may not be over just yet.
It is dangerous to put too much weight on any single indicator and the RSMTI is no exception. However, it is very unusual to see such a sharp rebound in equity prices that is not supported by relative strength, especially when the RSMTI has a history of leading market turning points.
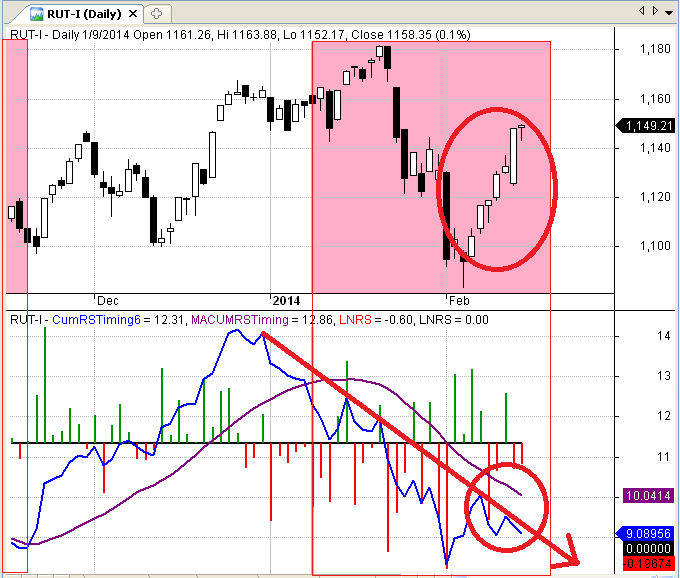
Figure 2: RUT RS Daily 02-14-2014
AMIBroker Code
The code below was designed to use three bullish and three bearish securities. However, you could modify the code to add more bullish or bearish symbol pairs. The three bullish and bearish symbols can be modified interactively in AMIBroker. The code and symbols used in the custom six-pair RSMTI depicted above are not provided in this article.

Figure 4: RS Market Timing Indicator - AMIBroker Code
Conclusion
I typically release new posts on Thursdays, but due to the timely nature of this material, I published this post early. The next scheduled post will be issued on Thursday February 27, 2014.
Individual technical indicators should never be used in isolation, but the RSMTI provides historically reliable early warning signals of market trend reversals - in any time frame. The current trend of the RSMTI is definitely bearish and the negative divergence is even more troubling.
It is possible that equity prices will continue to advance and that the RSMTI is lagging behind prices in this instance. However, that would be unusual. Changes in the RSMTI (and in the RUT) in the next week or two will be very telling.
Trader Edge Strategy E-Subscription Now Available: 20% ROR
The Trader Edge Asset Allocation Rotational (AAR) Strategy is a conservative, long-only, asset allocation strategy that rotates monthly among five large asset classes. The AAR strategy has generated approximately 20% annual returns over the combined back and forward test period (1/1/1990 to 7/29/2013). Please use the above link to learn more about the AAR strategy.
Feedback
Your comments, feedback, and questions are always welcome and appreciated. Please use the comment section at the bottom of this page or send me an email.
Referrals
If you found the information on www.TraderEdge.Net helpful, please pass along the link to your friends and colleagues or share the link with your social network.
The "Share / Save" button below contains links to all major social networks. If you do not see your social network listed, use the down-arrow to access the entire list of social networking sites.
Thank you for your support.
Brian Johnson
Copyright 2014 - Trading Insights, LLC - All Rights Reserved.
.


Pingback: 5 Near-Term Warning Signs | Trader Edge
Pingback: Relative Strength Indicator Predicted Current Pullback | Trader Edge