Despite the impressive V-shaped recovery in stock prices over the past two weeks, there is still serious cause for concern. There are five near-term warning signs the equity markets must vanquish before the bulls can declare a short-term victory over the bears.
SKEW Index
Very few traders track the CBOE SKEW Index, but it is a very useful tool for identifying equity environments with unusually high levels of downside risk. The SKEW Index is calculated from the price and volatility structure of options. When option buyers perceive more downside risk, they are willing to pay more for downside protection, primarily in the form of out-of-the-money (OTM) put options. This increases the price and the implied volatility of OTM put options, which is reflected in the vertical skew. In other words, OTM put options have a higher implied volatility than ATM put and call options.
The specific derivation of the SKEW Index is complex and beyond the scope of this article, but the interpretation of the SKEW Index is relatively straightforward. High levels of the SKEW Index correspond to high levels of downside risk. Typical SKEW Index values fall between 115 and 117.5. As of last Friday, February 21, 2014, the SKEW Index was 138.79 (red line in top panel of Figure 1 below).
The CBOE white paper on the SKEW Index provides several tables that interpret skew values. The nearest SKEW value in the tables was 140. Only 0.18% of all SKEW Index values are 140 or higher. This illustrates the extreme level of downside risk in the current market environment. In the top panel in Figure 1, you will note that the SKEW Index has reached or exceeded the 140 level three times in the past two months; this is very unusual. The first two occurrences preceded the minor pullback in late January. The most recent instance occurred last Friday.
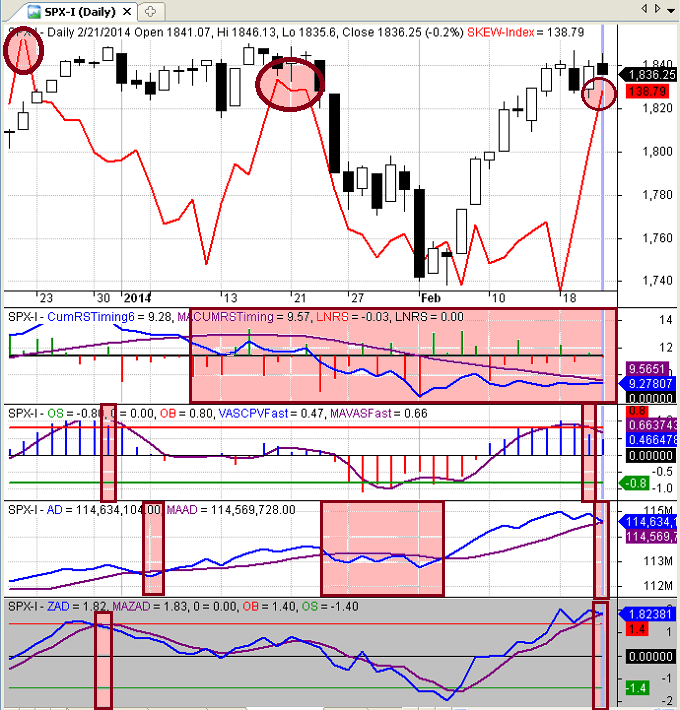
Figure 1: 5 Near-Term Warning Signs
The CBOE white paper also quantified the probability of black swan type events for specific SKEW Index values. A SKEW Index value of 140 corresponds to a 13.10% probability of a two standard deviation decline in the S&P 500 index in the next 30 days. This is 5.75 times the probability of a two standard deviation left-tail event based on a normal distribution.
A SKEW Index value of 140 corresponds to a 2.51% probability of a three standard deviation decline in the S&P 500 index in the next 30 days. The probability of a three standard deviation left-tail event would only be 0.13%, based on a normal distribution. In other words, the probability of a three-standard deviation black swan event occurring in the next 30-days is currently 19.3 times the probability implied by a normal distribution.
Here is the link to the CBOE SKEW Index, if you would like to learn more about this fascinating tool. You will also find the complete white paper on the CBOE site.
Relative Strength Market Timing Indicator (RSMTI)
The blue line in the second panel of Figure 1 above is the relative strength market timing indicator (RSMTI). The RSMTI represents the cumulative relative performance of six bullish and bearish security pairs. The purple line in the second panel depicts a 21-period moving average of the RSMTI. The RSMTI frequently leads market turning points.
I wrote about the RSMTI in last week's article titled Relative Strength Warning Sign. Please revisit that article for a more detailed description of the RSMTI. The RSMTI turned bearish (crossed below the moving average) in early January, which correctly signaled the pullback in late January. Despite the strong rebound in equity prices over the past two weeks, the RSMTI is still bearish. The recent rise in stock prices has not been supported by relative strength.
Volatility Adjusted Slope Indicator (VASI)
I originally wrote about the volatility adjusted slope indicator (VASI) in an article titled A Dual Purpose Trend Indicator, so I will not go into as much detail here. The fast version of the VASI is depicted in the third panel of Figure 1 above. The histogram values show the fast VASI, which represent the standardized daily volatility adjusted slope of the price function. The purple line is a three-period moving average of the fast VASI.
The strength of the trend can be determined by the magnitude of the VASI values. This means that the VASI can also be used as an oscillator as well as a trend indicator. Very strong trends are often unsustainable and lead to reversals, or at least to periods of consolidation. The red and green horizontal levels of +0.8 and -0.8 reflect extreme VASI thresholds. When the daily VASI value extends beyond one of the extreme thresholds, then crosses the moving average, this sets the stage for reversals.
As you can see in the third panel of Figure 1 above, a VASI bearish reversal signal occurred on December 31, 2013, providing advance warning of the January pullback. A second VASI bearish warning signal occurred last week on Thursday February 20, 2014.
Accumulation-Distribution Indicator
The accumulation-distribution indicator is one of the trend following indicators provided by AMIBroker. When combined with a simple moving average, the accumulation-distribution indicator can identify bullish and bearish market environments. The blue line in the fourth panel of Figure 1 above represents the accumulation-distribution indicator. The purple line is a moving average of the blue accumulation-distribution oscillator.
Shortly before and again during the recent pullback in January, the accumulation distribution indicator turned bearish (dropped below its moving average). Last Friday, the accumulation distribution indicator declined and currently rests just above its moving average. A further drop on on Monday would push this indicator into bearish territory.
Breadth Oscillator
I introduced the short-term market breadth oscillator in an article titled "The Secret Weapon of Technical Analysis." Increasing breadth is good, but it is possible to have too much of a good thing. Excessive increases in market breadth often lead to short-term reversals. The blue line in the bottom panel of Figure 1 above represents the short-term breadth oscillator and the purple line is a moving average of the breadth oscillator. The red and green lines illustrate extreme breadth thresholds.
A bearish signal occurs when the breadth oscillator moves above the extreme threshold and then falls below its moving average. This occurred on December 31, 2013, correctly predicting the January market pullback. The most recent bearish breadth signal occurred last Friday, February 21, 2014.
Conclusion
I typically release new posts on Thursdays, but due to the timely nature of this material, I published this post early, as I did last week. The next scheduled post will be issued on Thursday March 6, 2014.
Individual technical indicators should never be used in isolation, but when five historically reliable indicators all support the same conclusion, the signal bears more weight. Furthermore, the above technical signals were derived from different data sources: the volatility skew, relative strength, breadth, price, and volume. The CBOE SKEW Index, the RSMTI, the fast VASI, the accumulation-distribution indicator, and the breadth oscillator all suggest the recent reversal may have more legs.
Placing bearish trades during bull markets is a loser's game. Nevertheless, reducing risk or tightening stops in high-risk environments is prudent.
Trader Edge Strategy E-Subscription Now Available: 20% ROR
The Trader Edge Asset Allocation Rotational (AAR) Strategy is a conservative, long-only, asset allocation strategy that rotates monthly among five large asset classes. The AAR strategy has generated approximately 20% annual returns over the combined back and forward test period (1/1/1990 to 7/29/2013). Please use the above link to learn more about the AAR strategy.
Feedback
Your comments, feedback, and questions are always welcome and appreciated. Please use the comment section at the bottom of this page or send me an email.
Referrals
If you found the information on www.TraderEdge.Net helpful, please pass along the link to your friends and colleagues or share the link with your social network.
The "Share / Save" button below contains links to all major social networks. If you do not see your social network listed, use the down-arrow to access the entire list of social networking sites.
Thank you for your support.
Brian Johnson
Copyright 2014 - Trading Insights, LLC - All Rights Reserved.


5 Near-Term Warning Signs
Despite the impressive V-shaped recovery in stock prices over the past two weeks, there is still serious cause for concern. There are five near-term warning signs the equity markets must vanquish before the bulls can declare a short-term victory over the bears.
SKEW Index
Very few traders track the CBOE SKEW Index, but it is a very useful tool for identifying equity environments with unusually high levels of downside risk. The SKEW Index is calculated from the price and volatility structure of options. When option buyers perceive more downside risk, they are willing to pay more for downside protection, primarily in the form of out-of-the-money (OTM) put options. This increases the price and the implied volatility of OTM put options, which is reflected in the vertical skew. In other words, OTM put options have a higher implied volatility than ATM put and call options.
The specific derivation of the SKEW Index is complex and beyond the scope of this article, but the interpretation of the SKEW Index is relatively straightforward. High levels of the SKEW Index correspond to high levels of downside risk. Typical SKEW Index values fall between 115 and 117.5. As of last Friday, February 21, 2014, the SKEW Index was 138.79 (red line in top panel of Figure 1 below).
The CBOE white paper on the SKEW Index provides several tables that interpret skew values. The nearest SKEW value in the tables was 140. Only 0.18% of all SKEW Index values are 140 or higher. This illustrates the extreme level of downside risk in the current market environment. In the top panel in Figure 1, you will note that the SKEW Index has reached or exceeded the 140 level three times in the past two months; this is very unusual. The first two occurrences preceded the minor pullback in late January. The most recent instance occurred last Friday.
Figure 1: 5 Near-Term Warning Signs
The CBOE white paper also quantified the probability of black swan type events for specific SKEW Index values. A SKEW Index value of 140 corresponds to a 13.10% probability of a two standard deviation decline in the S&P 500 index in the next 30 days. This is 5.75 times the probability of a two standard deviation left-tail event based on a normal distribution.
A SKEW Index value of 140 corresponds to a 2.51% probability of a three standard deviation decline in the S&P 500 index in the next 30 days. The probability of a three standard deviation left-tail event would only be 0.13%, based on a normal distribution. In other words, the probability of a three-standard deviation black swan event occurring in the next 30-days is currently 19.3 times the probability implied by a normal distribution.
Here is the link to the CBOE SKEW Index, if you would like to learn more about this fascinating tool. You will also find the complete white paper on the CBOE site.
Relative Strength Market Timing Indicator (RSMTI)
The blue line in the second panel of Figure 1 above is the relative strength market timing indicator (RSMTI). The RSMTI represents the cumulative relative performance of six bullish and bearish security pairs. The purple line in the second panel depicts a 21-period moving average of the RSMTI. The RSMTI frequently leads market turning points.
I wrote about the RSMTI in last week's article titled Relative Strength Warning Sign. Please revisit that article for a more detailed description of the RSMTI. The RSMTI turned bearish (crossed below the moving average) in early January, which correctly signaled the pullback in late January. Despite the strong rebound in equity prices over the past two weeks, the RSMTI is still bearish. The recent rise in stock prices has not been supported by relative strength.
Volatility Adjusted Slope Indicator (VASI)
I originally wrote about the volatility adjusted slope indicator (VASI) in an article titled A Dual Purpose Trend Indicator, so I will not go into as much detail here. The fast version of the VASI is depicted in the third panel of Figure 1 above. The histogram values show the fast VASI, which represent the standardized daily volatility adjusted slope of the price function. The purple line is a three-period moving average of the fast VASI.
The strength of the trend can be determined by the magnitude of the VASI values. This means that the VASI can also be used as an oscillator as well as a trend indicator. Very strong trends are often unsustainable and lead to reversals, or at least to periods of consolidation. The red and green horizontal levels of +0.8 and -0.8 reflect extreme VASI thresholds. When the daily VASI value extends beyond one of the extreme thresholds, then crosses the moving average, this sets the stage for reversals.
As you can see in the third panel of Figure 1 above, a VASI bearish reversal signal occurred on December 31, 2013, providing advance warning of the January pullback. A second VASI bearish warning signal occurred last week on Thursday February 20, 2014.
Accumulation-Distribution Indicator
The accumulation-distribution indicator is one of the trend following indicators provided by AMIBroker. When combined with a simple moving average, the accumulation-distribution indicator can identify bullish and bearish market environments. The blue line in the fourth panel of Figure 1 above represents the accumulation-distribution indicator. The purple line is a moving average of the blue accumulation-distribution oscillator.
Shortly before and again during the recent pullback in January, the accumulation distribution indicator turned bearish (dropped below its moving average). Last Friday, the accumulation distribution indicator declined and currently rests just above its moving average. A further drop on on Monday would push this indicator into bearish territory.
Breadth Oscillator
I introduced the short-term market breadth oscillator in an article titled "The Secret Weapon of Technical Analysis." Increasing breadth is good, but it is possible to have too much of a good thing. Excessive increases in market breadth often lead to short-term reversals. The blue line in the bottom panel of Figure 1 above represents the short-term breadth oscillator and the purple line is a moving average of the breadth oscillator. The red and green lines illustrate extreme breadth thresholds.
A bearish signal occurs when the breadth oscillator moves above the extreme threshold and then falls below its moving average. This occurred on December 31, 2013, correctly predicting the January market pullback. The most recent bearish breadth signal occurred last Friday, February 21, 2014.
Conclusion
I typically release new posts on Thursdays, but due to the timely nature of this material, I published this post early, as I did last week. The next scheduled post will be issued on Thursday March 6, 2014.
Individual technical indicators should never be used in isolation, but when five historically reliable indicators all support the same conclusion, the signal bears more weight. Furthermore, the above technical signals were derived from different data sources: the volatility skew, relative strength, breadth, price, and volume. The CBOE SKEW Index, the RSMTI, the fast VASI, the accumulation-distribution indicator, and the breadth oscillator all suggest the recent reversal may have more legs.
Placing bearish trades during bull markets is a loser's game. Nevertheless, reducing risk or tightening stops in high-risk environments is prudent.
Trader Edge Strategy E-Subscription Now Available: 20% ROR
The Trader Edge Asset Allocation Rotational (AAR) Strategy is a conservative, long-only, asset allocation strategy that rotates monthly among five large asset classes. The AAR strategy has generated approximately 20% annual returns over the combined back and forward test period (1/1/1990 to 7/29/2013). Please use the above link to learn more about the AAR strategy.
Feedback
Your comments, feedback, and questions are always welcome and appreciated. Please use the comment section at the bottom of this page or send me an email.
Referrals
If you found the information on www.TraderEdge.Net helpful, please pass along the link to your friends and colleagues or share the link with your social network.
The "Share / Save" button below contains links to all major social networks. If you do not see your social network listed, use the down-arrow to access the entire list of social networking sites.
Thank you for your support.
Brian Johnson
Copyright 2014 - Trading Insights, LLC - All Rights Reserved.
About Brian Johnson
I have been an investment professional for over 30 years. I worked as a fixed income portfolio manager, personally managing over $13 billion in assets for institutional clients. I was also the President of a financial consulting and software development firm, developing artificial intelligence based forecasting and risk management systems for institutional investment managers. I am now a full-time proprietary trader in options, futures, stocks, and ETFs using both algorithmic and discretionary trading strategies. In addition to my professional investment experience, I designed and taught courses in financial derivatives for both MBA and undergraduate business programs on a part-time basis for a number of years. I have also written four books on options and derivative strategies.