The weekly relative strength market timing indicator (RSMTI) signaled the current equity market pullback on January 24, 2014 when the indicator crossed below its 21-week moving average. The daily RSMTI provides earlier signals than the weekly RSMTI and is more useful for identifying short-term trends. However, when the weekly RSMTI crosses below its 21-week moving average, it is an indication of more protracted pullbacks, many of which extend for several months.
The daily and weekly RSMTI are still below their respective 21-period moving averages, although the daily RSMTI has gained some ground recently. The weekly RSMTI is still well below its 21-week moving average and the monthly RSMTI is declining and threatening to cross below its 21-month moving average. Simultaneous negative RSMTI signals from all three periods would have serious implications for the equity market.
Relative Strength Market Timing Indicator (RSMTI)
In a 2012 post titled "Market Timing with Relative Strength Revisited," I introduced a market timing indicator based on the relative strength of multiple bullish and bearish security pairs. The approach was based on the article "Applying The Sector Rotation Model," written by Giorgos E. Siligardos. The Siligardos article appeared in the August 2012 issue of Technical Analysis of Stocks and Commodities (TASC).
My 2012 post was comprehensive and explained all of the steps required to create and program the relative strength market timing indicator (RSMTI) using three pairs of bullish and bearish securities. As a result, I will not review the procedure again in this article. If you missed the original piece, I encourage you to read it in detail. It was one of the most popular articles on Trader Edge.
For those of you who have not read the original post, the RSMTI calculates the cumulative return differences between multiple bullish and bearish security pairs over time. Changes in market direction are often revealed through the relative performance of these security pairs before they become evident in the equity markets. The RSMTI in the original article included three security pairs, but the examples below use a custom version of the RSMTI with six security pairs.
In mid-February of 2014, I published two posts that presaged the current pullback: "Relative Strength Warning Sign" and "5 Near-Term Warning Signs." Both articles used the RSMTI to identify the current equity market pullback.
Timing with Relative Strength
The top panel in Figure 1 below is a weekly candlestick chart of the Russell 2000 index (RUT) from early 2011 to 4/16/2014. The pink shaded regions in the chart correspond to bearish or cautionary periods when the relative strength timing indicator was below its 21-week moving average.
As you can see in Figure 1, the RSMTI peaked in December of 2013, well before RUT. The bearish RSMTI crossover signal was generated on January 24, 2014, over a month before RUT peaked. The weekly RSMTI is still declining and the gap between the RSMTI and its 21-week moving average has not narrowed. As mentioned above, the daily RSMTI is also below its 21-period moving average and the monthly RSMTI is declining and is threatening to penetrate its 21-period moving average as well.
To make matters worse, the equity market is currently overvalued and we are heading into a very weak seasonal period that will last for several months. While the most recent recession model forecast is still benign, that does not guarantee the current pullback could not become more severe.
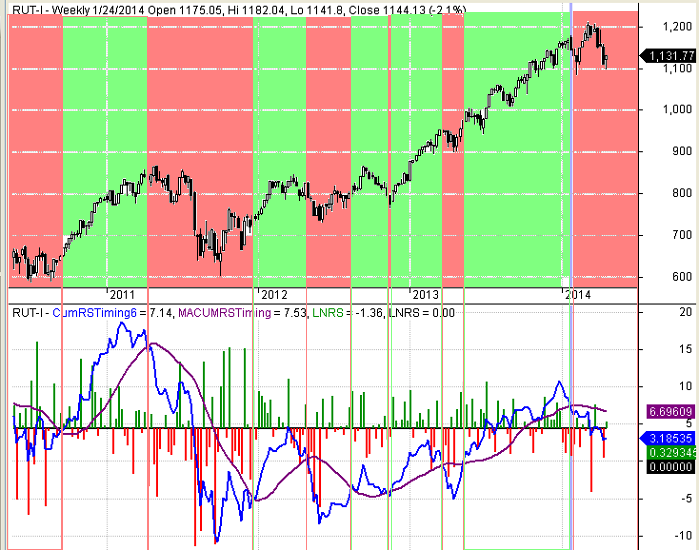
Figure 1: Weekly RSMTI on April 16,2014
Conclusion
Individual technical indicators should never be used in isolation, but the RSMTI provides historically reliable early warning signals of market trend reversals - in any time frame. The current trend of the RSMTI is definitely bearish. Until the RSMTI stabilizes and begins to improve, additional caution would be warranted.
Trader Edge Strategy E-Subscription Now Available: 20% ROR
The Trader Edge Asset Allocation Rotational (AAR) Strategy is a conservative, long-only, asset allocation strategy that rotates monthly among five large asset classes. The AAR strategy has generated approximately 20% annual returns over the combined back and forward test period (1/1/1990 to 7/29/2013). Please use the above link to learn more about the AAR strategy.
Brian Johnson's New Book is Now Available on Amazon
Option Strategy Risk / Return Ratios: A Revolutionary New Approach to Optimizing, Adjusting, and Trading Any Option Income Strategy
Feedback
Your comments, feedback, and questions are always welcome and appreciated. Please use the comment section at the bottom of this page or send me an email.
Referrals
If you found the information on www.TraderEdge.Net helpful, please pass along the link to your friends and colleagues or share the link with your social network.
The "Share / Save" button below contains links to all major social networks. If you do not see your social network listed, use the down-arrow to access the entire list of social networking sites.
Thank you for your support.
Brian Johnson
Copyright 2014 - Trading Insights, LLC - All Rights Reserved.
.
About Brian Johnson
I have been an investment professional for over 30 years. I worked as a fixed income portfolio manager, personally managing over $13 billion in assets for institutional clients. I was also the President of a financial consulting and software development firm, developing artificial intelligence based forecasting and risk management systems for institutional investment managers.
I am now a full-time proprietary trader in options, futures, stocks, and ETFs using both algorithmic and discretionary trading strategies.
In addition to my professional investment experience, I designed and taught courses in financial derivatives for both MBA and undergraduate business programs on a part-time basis for a number of years. I have also written four books on options and derivative strategies.


Relative Strength Indicator Predicted Current Pullback
The weekly relative strength market timing indicator (RSMTI) signaled the current equity market pullback on January 24, 2014 when the indicator crossed below its 21-week moving average. The daily RSMTI provides earlier signals than the weekly RSMTI and is more useful for identifying short-term trends. However, when the weekly RSMTI crosses below its 21-week moving average, it is an indication of more protracted pullbacks, many of which extend for several months.
The daily and weekly RSMTI are still below their respective 21-period moving averages, although the daily RSMTI has gained some ground recently. The weekly RSMTI is still well below its 21-week moving average and the monthly RSMTI is declining and threatening to cross below its 21-month moving average. Simultaneous negative RSMTI signals from all three periods would have serious implications for the equity market.
Relative Strength Market Timing Indicator (RSMTI)
In a 2012 post titled "Market Timing with Relative Strength Revisited," I introduced a market timing indicator based on the relative strength of multiple bullish and bearish security pairs. The approach was based on the article "Applying The Sector Rotation Model," written by Giorgos E. Siligardos. The Siligardos article appeared in the August 2012 issue of Technical Analysis of Stocks and Commodities (TASC).
My 2012 post was comprehensive and explained all of the steps required to create and program the relative strength market timing indicator (RSMTI) using three pairs of bullish and bearish securities. As a result, I will not review the procedure again in this article. If you missed the original piece, I encourage you to read it in detail. It was one of the most popular articles on Trader Edge.
For those of you who have not read the original post, the RSMTI calculates the cumulative return differences between multiple bullish and bearish security pairs over time. Changes in market direction are often revealed through the relative performance of these security pairs before they become evident in the equity markets. The RSMTI in the original article included three security pairs, but the examples below use a custom version of the RSMTI with six security pairs.
In mid-February of 2014, I published two posts that presaged the current pullback: "Relative Strength Warning Sign" and "5 Near-Term Warning Signs." Both articles used the RSMTI to identify the current equity market pullback.
Timing with Relative Strength
The top panel in Figure 1 below is a weekly candlestick chart of the Russell 2000 index (RUT) from early 2011 to 4/16/2014. The pink shaded regions in the chart correspond to bearish or cautionary periods when the relative strength timing indicator was below its 21-week moving average.
As you can see in Figure 1, the RSMTI peaked in December of 2013, well before RUT. The bearish RSMTI crossover signal was generated on January 24, 2014, over a month before RUT peaked. The weekly RSMTI is still declining and the gap between the RSMTI and its 21-week moving average has not narrowed. As mentioned above, the daily RSMTI is also below its 21-period moving average and the monthly RSMTI is declining and is threatening to penetrate its 21-period moving average as well.
To make matters worse, the equity market is currently overvalued and we are heading into a very weak seasonal period that will last for several months. While the most recent recession model forecast is still benign, that does not guarantee the current pullback could not become more severe.
Figure 1: Weekly RSMTI on April 16,2014
Conclusion
Individual technical indicators should never be used in isolation, but the RSMTI provides historically reliable early warning signals of market trend reversals - in any time frame. The current trend of the RSMTI is definitely bearish. Until the RSMTI stabilizes and begins to improve, additional caution would be warranted.
Trader Edge Strategy E-Subscription Now Available: 20% ROR
The Trader Edge Asset Allocation Rotational (AAR) Strategy is a conservative, long-only, asset allocation strategy that rotates monthly among five large asset classes. The AAR strategy has generated approximately 20% annual returns over the combined back and forward test period (1/1/1990 to 7/29/2013). Please use the above link to learn more about the AAR strategy.
Brian Johnson's New Book is Now Available on Amazon
Option Strategy Risk / Return Ratios: A Revolutionary New Approach to Optimizing, Adjusting, and Trading Any Option Income Strategy
Feedback
Your comments, feedback, and questions are always welcome and appreciated. Please use the comment section at the bottom of this page or send me an email.
Referrals
If you found the information on www.TraderEdge.Net helpful, please pass along the link to your friends and colleagues or share the link with your social network.
The "Share / Save" button below contains links to all major social networks. If you do not see your social network listed, use the down-arrow to access the entire list of social networking sites.
Thank you for your support.
Brian Johnson
Copyright 2014 - Trading Insights, LLC - All Rights Reserved.
.
About Brian Johnson
I have been an investment professional for over 30 years. I worked as a fixed income portfolio manager, personally managing over $13 billion in assets for institutional clients. I was also the President of a financial consulting and software development firm, developing artificial intelligence based forecasting and risk management systems for institutional investment managers. I am now a full-time proprietary trader in options, futures, stocks, and ETFs using both algorithmic and discretionary trading strategies. In addition to my professional investment experience, I designed and taught courses in financial derivatives for both MBA and undergraduate business programs on a part-time basis for a number of years. I have also written four books on options and derivative strategies.