The following article updates the diffusion index, recession slack index, aggregate recession model, and aggregate peak-trough model through December 2016. Throughout 2015, I added a number of new economic and market-based variables with very strong explanatory power to the recession model. This allowed me to cull three of the original independent variables with the weakest historical performance and most questionable cause and effect recessionary influence. I added one new variable with surprisingly strong explanatory power at the end of February 2016. The current 21-variable model has a diverse set of explanatory variables and is quite robust.
Each of the explanatory variables has predictive power individually; when combined, the group of indicators is able to identify early recession warnings from a wide range of diverse market-based, fundamental, technical, and economic sources. After the latest additions and deletions, the total number of explanatory recession model variables is now 21. The current and historical data in this report reflect the current model configuration with all 21 variables.
Diffusion Index
The Trader Edge diffusion index equals the percentage of independent variables indicating a recession. With the recent changes, there are now a total of 21 explanatory variables, each with a unique look-back period and recession threshold. The resulting diffusion index and changes in the diffusion index are used to calculate the probit, logit, and neural network model forecasts.
The graph of the diffusion index from 1/1/2006 to 1/1/2017 is presented in Figure 1 below (in red - left axis). The gray shaded regions in Figure 1 below represent U.S. recessions as defined (after the fact) by the National Bureau of Economic Research (NBER). The value of the S&P 500 index is also included (in blue - right axis).
In December 2014, for the first time since December 2012, one of the 21 explanatory variables indicated a recessionary environment. In 2015 and 2016, the number of explanatory variables indicating a recession varied between one and eight, with the peak occurring in January of 2016. Between February 2016 and May 2016, the number of explanatory variables indicating a recession varied between seven and four. From July through December, the number varied between one and two. The number of variables indicating a recession is currently one out of 21 (4.8%), down one from the prior month.
As I have explained before, several of the explanatory variables are market-based. These variables respond very quickly to changing market conditions and are never revised. This makes the Trader Edge recession model much more responsive than other recession models. The sharp rebound in the price of risk-assets in March/April improved the U.S. economic outlook, which significantly reduced the risk of an imminent U.S. recession. The subsequent market gains and improving economic data further reduced the risk of a US recession.
Please note that past estimates and index values will change whenever the historical data is revised. All current and past forecasts and index calculations are based on the latest revised data from the current data set.
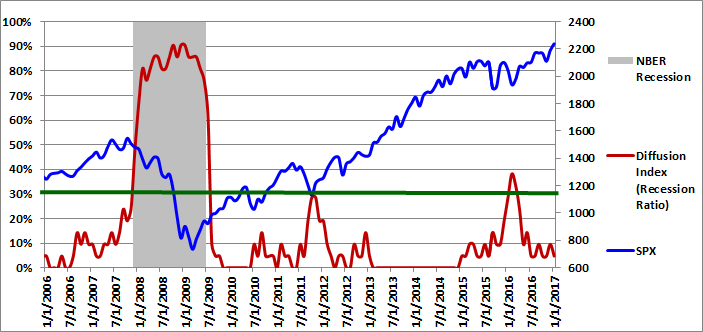
Figure 1: Diffusion Index 01-01-2017
Recession Slack Index
The Trader Edge recession slack index equals the median standardized deviation of the current value of the explanatory variables from their respective recession thresholds. The resulting value signifies the amount of slack or cushion relative to the recession threshold, expressed in terms of the number of standard deviations. Higher slack values signify larger cushions above recessionary threshold levels.
The gray shaded regions in Figure 2 below represent U.S. recessions as defined (after the fact) by the NBER. The median recession slack index is depicted in purple and is plotted against the right axis, which is expressed as the number of standard deviations above the recession threshold.
The dark-red, horizontal line at 0.50 standard deviations denotes a possible warning threshold for the recession slack index. Many of the past recessions began when the recession slack index crossed below 0.50. Similarly, many of the past recessions ended when the recession slack index crossed back above 0.0.
In mid-2014, the revised median recession slack index peaked at 1.15, far above the warning level of 0.50. The recession slack index declined significantly in 2015, with a high of 0.94 and a low of 0.39. The recession slack index fell further in early 2016, reaching its low of 0.32 in February, before rebounding over the next few months.
The recession slack index is currently 1.22, which is up sharply from 0.96 at the end of November. The current value of 1.22 is the highest U.S. recession cushion since early 2013. However, much higher readings were recorded earlier in the recovery. Regardless, the amount of cushion is significant.
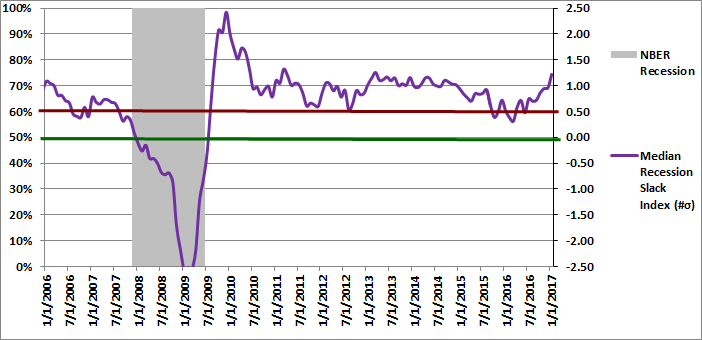
Figure 2: Median Recession Slack Index 01-01-2017
To gain further insight into the slack index, I recently went back and calculated a derivative value: the percentage of variables with increasing slack each month. The possible values range from zero percent to 100 percent. Due to the monthly volatility, I provide the three-month moving average of the percentage of variables with increasing slack in Figure 3, but I personally monitor the monthly percentages as well.
Slack is a standardized value, so it is directly comparable across all variables. More slack indicates a larger cushion relative to a recessionary environment. As a result, we would like to see as many variables as possible with increasing slack. Given the diverse nature of the explanatory variables, it is unusual to see more than 60% of the variables with increasing slack or fewer than 40% of the variables with increasing slack. These extreme values are significant and predictive of the near-term direction of economic growth and often the equity market.
Note the very sharp rebound in the percentage of variables with increasing slack before the end of the 2007-2008 great recession. Roughly 90% of the variables demonstrated increasing slack by the end of the recession. Similarly, the percentage of variables with increasing slack plummeted below 30% months before the 2007-2008 recession began. The percentage plunged below 30% again in early 2015, well before the softening in the economy and corresponding market pull-back later that year. The most recent moving average percentage is 57.1%, which is down slightly from last month's revised value of 60.3%, which is not surprising given the unusually strong percentage last month. It is unusual for the moving average to exceed 60%. The current value of 57.1% is indicative of a strengthening U.S. economy.
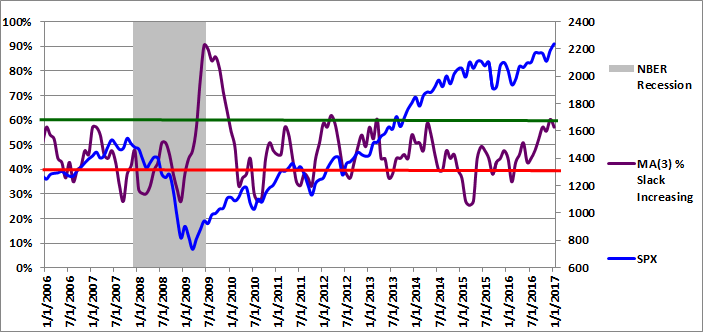
Figure 3: MA(3) % Slack Increasing 01-01-2017
The ability to track small variations and trend changes over time illustrates the advantage of monitoring the continuous recession slack index. The new slack variable will provide additional insight into the near-term direction of the economy and should be used in conjunction with the median recession slack index.
While it is useful to track the actual recession slack index values and percentage of variables with increasing slack, the diffusion percentages and slack index values are also used to generate the more intuitive probit and logit probability forecasts.
Aggregate Recession Probability Estimate
The Trader Edge aggregate recession model is the average of four models: the probit and logit models based on the diffusion index and the probit and logit models based on the recession slack index. The aggregate recession model estimates from 1/1/2006 to 1/01/2017 are depicted in Figure 4 below (red line - left vertical axis). The gray shaded regions represent NBER recessions and the blue line reflects the value of the S&P 500 index (right vertical axis). I suggest using a warning threshold of between 20-30% for the aggregate recession model (green horizontal line).
The aggregate recession model probability estimate decreased from 0.2% in November 2016 to 0.0% in December 2016. According to the model, the probability that the U.S. is currently in a recession continues to be extremely remote.
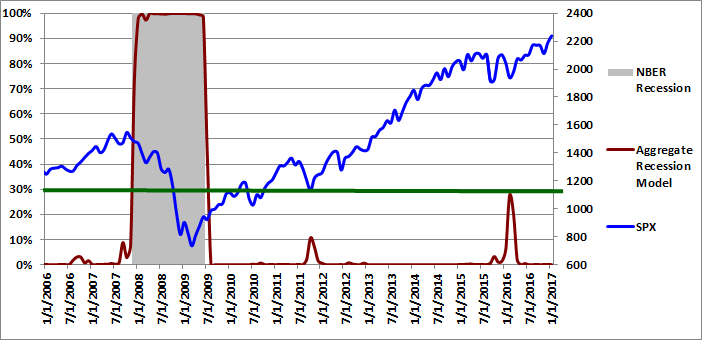
Figure 4: Aggregate Recession Model 01-01-2017
Aggregate Peak-Trough Probability Estimate
The peak-trough model forecasts are different from the recession model. The peak-trough models estimate the probability of the S&P 500 being between the peak and trough associated with an NBER recession. The S&P 500 typically peaks before recessions begin and bottoms out before recessions end. As a result, it is far more difficult for the peak-trough model to fit this data and the model forecasts have larger errors than the recession model.
The Trader Edge aggregate peak-trough model equals the weighted-average of nine different models: the probit and logit models based on the diffusion index, the probit and logit models based on the recession slack index, and five neural network models.
The aggregate peak-trough model estimates from 1/1/2006 to 1/01/2017 are depicted in Figure 5 below, which uses the same format as Figure 4, except that the shaded regions represent the periods between the peaks and troughs associated with NBER recessions.
The aggregate peak-trough model probability estimate for 1/01/2017 was 2.7%, which was down slightly from the revised value of 3.5% at the end of November 2016.
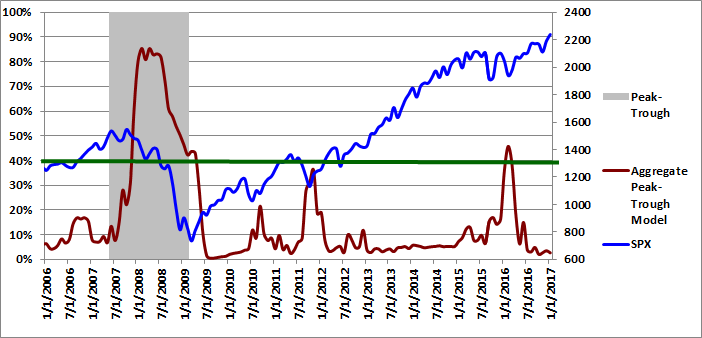
Figure 5: Aggregate Peak-Trough Model 01-01-2017
Conclusion
January and February 2016 marked a potential tipping point in U.S. recession risk, but that risk declined significantly in March and April. Recession risk fluctuated in subsequent months, but continued to decline. The recent decrease in recession risk is supported by both market and non-market variables. The median recession slack index has now increased significantly, confirming the improvement in the diffusion index.
The use of several market-based indicators makes the Trader Edge recession model more responsive than many other models. Relative to traditional economic variables, market-based data have important advantages: they are highly predictive, they are never restated, and there is no lag in receiving the data. The market-based variables improved in March and April, reversed direction briefly, but are again trending higher.
However, reduced recession risk does not eliminate downside risk in the equity markets. The U.S. equity market remains significantly overvalued (highest price-to-sales ratio ever). In addition, S&P earnings have declined by roughly 20% since 2015. Over the same period, the price of the S&P 500 index increased by over 10%. This divergence expanded P/E ratios to historically overvalued levels. While we may be poised for a period of earnings growth, earnings would have to increase by almost 30% (at current price levels) to return to the overvalued P/E levels of 2015.
Mark Hulbert's recent article, "The biggest threat to your money now? Ignoring the scent of a bear market," provides further insight into the relative value of the U.S. equity market. According to Hulbert's research, the current stock market is more overvalued that it was at 80-95% of the last century's bull-market peaks - according to six different valuation measures. For those betting on a Trump policy windfall, Hulbert makes a critical point:
I want to address one potential retort to my assertion that the stock market is overvalued: A big cut in the corporate tax rate, which Donald Trump has said he would implement, would give such a big boost to corporate after-tax profits that the stock market would no longer be overvalued.
Don’t believe it. According to an analysis from Ned Davis Research, a cut in the effective corporate tax rate to 15% would add an estimated $12.84 to the S&P 500’s SPX, -0.18% earnings per share. That would reduce the market’s P/E ratio from its current 22.9 to 20.2, when calculated based on trailing 12 months as-reported earnings. That would still be far higher than the 145-year average of 15.6 (according to data from Yale University’s Robert Shiller).
In other words, even if the corporate tax rate were reduced to 15% and corporate earnings were to increase by $12.84 per share, the market would still be overvalued. This rosy picture also assumes that Trump's protectionist trade policies caused no adverse earnings effects. Even in this ideal scenario, the resulting S&P earnings would still be well below the 2015 earnings with much higher prices - not a recipe for low-risk incremental returns.
Unlike human prognosticators, the Trader Edge recession model is completely objective and has no ego. It is not burdened by the emotional need to defend past erroneous forecasts and will always consistently apply the insights gained from new data.
Brian Johnson
Copyright 2017 Trading Insights, LLC. All rights reserved.
Print and Kindle Versions of Brian Johnson's New In-Depth (100+ page) Options Article are Now Available on Amazon.
Option Income Strategy Trade Filters: An In-Depth Article Demonstrating the Use of Trade Filters to Enhance Returns and Reduce Risk
Print and Kindle Versions of Brian Johnson's 2nd Book are Available on Amazon (75% 5-Star Reviews)
Exploiting Earnings Volatility: An Innovative New Approach to Evaluating, Optimizing, and Trading Option Strategies to Profit from Earnings Announcements.
Print and Kindle Versions of Brian Johnson's 1st Book are Available on Amazon (79% 5-Star Reviews)
Option Strategy Risk / Return Ratios: A Revolutionary New Approach to Optimizing, Adjusting, and Trading Any Option Income Strategy


Recession Model Forecast: 01-01-2017
The following article updates the diffusion index, recession slack index, aggregate recession model, and aggregate peak-trough model through December 2016. Throughout 2015, I added a number of new economic and market-based variables with very strong explanatory power to the recession model. This allowed me to cull three of the original independent variables with the weakest historical performance and most questionable cause and effect recessionary influence. I added one new variable with surprisingly strong explanatory power at the end of February 2016. The current 21-variable model has a diverse set of explanatory variables and is quite robust.
Each of the explanatory variables has predictive power individually; when combined, the group of indicators is able to identify early recession warnings from a wide range of diverse market-based, fundamental, technical, and economic sources. After the latest additions and deletions, the total number of explanatory recession model variables is now 21. The current and historical data in this report reflect the current model configuration with all 21 variables.
Diffusion Index
The Trader Edge diffusion index equals the percentage of independent variables indicating a recession. With the recent changes, there are now a total of 21 explanatory variables, each with a unique look-back period and recession threshold. The resulting diffusion index and changes in the diffusion index are used to calculate the probit, logit, and neural network model forecasts.
The graph of the diffusion index from 1/1/2006 to 1/1/2017 is presented in Figure 1 below (in red - left axis). The gray shaded regions in Figure 1 below represent U.S. recessions as defined (after the fact) by the National Bureau of Economic Research (NBER). The value of the S&P 500 index is also included (in blue - right axis).
In December 2014, for the first time since December 2012, one of the 21 explanatory variables indicated a recessionary environment. In 2015 and 2016, the number of explanatory variables indicating a recession varied between one and eight, with the peak occurring in January of 2016. Between February 2016 and May 2016, the number of explanatory variables indicating a recession varied between seven and four. From July through December, the number varied between one and two. The number of variables indicating a recession is currently one out of 21 (4.8%), down one from the prior month.
As I have explained before, several of the explanatory variables are market-based. These variables respond very quickly to changing market conditions and are never revised. This makes the Trader Edge recession model much more responsive than other recession models. The sharp rebound in the price of risk-assets in March/April improved the U.S. economic outlook, which significantly reduced the risk of an imminent U.S. recession. The subsequent market gains and improving economic data further reduced the risk of a US recession.
Please note that past estimates and index values will change whenever the historical data is revised. All current and past forecasts and index calculations are based on the latest revised data from the current data set.
Figure 1: Diffusion Index 01-01-2017
Recession Slack Index
The Trader Edge recession slack index equals the median standardized deviation of the current value of the explanatory variables from their respective recession thresholds. The resulting value signifies the amount of slack or cushion relative to the recession threshold, expressed in terms of the number of standard deviations. Higher slack values signify larger cushions above recessionary threshold levels.
The gray shaded regions in Figure 2 below represent U.S. recessions as defined (after the fact) by the NBER. The median recession slack index is depicted in purple and is plotted against the right axis, which is expressed as the number of standard deviations above the recession threshold.
The dark-red, horizontal line at 0.50 standard deviations denotes a possible warning threshold for the recession slack index. Many of the past recessions began when the recession slack index crossed below 0.50. Similarly, many of the past recessions ended when the recession slack index crossed back above 0.0.
In mid-2014, the revised median recession slack index peaked at 1.15, far above the warning level of 0.50. The recession slack index declined significantly in 2015, with a high of 0.94 and a low of 0.39. The recession slack index fell further in early 2016, reaching its low of 0.32 in February, before rebounding over the next few months.
The recession slack index is currently 1.22, which is up sharply from 0.96 at the end of November. The current value of 1.22 is the highest U.S. recession cushion since early 2013. However, much higher readings were recorded earlier in the recovery. Regardless, the amount of cushion is significant.
Figure 2: Median Recession Slack Index 01-01-2017
To gain further insight into the slack index, I recently went back and calculated a derivative value: the percentage of variables with increasing slack each month. The possible values range from zero percent to 100 percent. Due to the monthly volatility, I provide the three-month moving average of the percentage of variables with increasing slack in Figure 3, but I personally monitor the monthly percentages as well.
Slack is a standardized value, so it is directly comparable across all variables. More slack indicates a larger cushion relative to a recessionary environment. As a result, we would like to see as many variables as possible with increasing slack. Given the diverse nature of the explanatory variables, it is unusual to see more than 60% of the variables with increasing slack or fewer than 40% of the variables with increasing slack. These extreme values are significant and predictive of the near-term direction of economic growth and often the equity market.
Note the very sharp rebound in the percentage of variables with increasing slack before the end of the 2007-2008 great recession. Roughly 90% of the variables demonstrated increasing slack by the end of the recession. Similarly, the percentage of variables with increasing slack plummeted below 30% months before the 2007-2008 recession began. The percentage plunged below 30% again in early 2015, well before the softening in the economy and corresponding market pull-back later that year. The most recent moving average percentage is 57.1%, which is down slightly from last month's revised value of 60.3%, which is not surprising given the unusually strong percentage last month. It is unusual for the moving average to exceed 60%. The current value of 57.1% is indicative of a strengthening U.S. economy.
Figure 3: MA(3) % Slack Increasing 01-01-2017
The ability to track small variations and trend changes over time illustrates the advantage of monitoring the continuous recession slack index. The new slack variable will provide additional insight into the near-term direction of the economy and should be used in conjunction with the median recession slack index.
While it is useful to track the actual recession slack index values and percentage of variables with increasing slack, the diffusion percentages and slack index values are also used to generate the more intuitive probit and logit probability forecasts.
Aggregate Recession Probability Estimate
The Trader Edge aggregate recession model is the average of four models: the probit and logit models based on the diffusion index and the probit and logit models based on the recession slack index. The aggregate recession model estimates from 1/1/2006 to 1/01/2017 are depicted in Figure 4 below (red line - left vertical axis). The gray shaded regions represent NBER recessions and the blue line reflects the value of the S&P 500 index (right vertical axis). I suggest using a warning threshold of between 20-30% for the aggregate recession model (green horizontal line).
The aggregate recession model probability estimate decreased from 0.2% in November 2016 to 0.0% in December 2016. According to the model, the probability that the U.S. is currently in a recession continues to be extremely remote.
Figure 4: Aggregate Recession Model 01-01-2017
Aggregate Peak-Trough Probability Estimate
The peak-trough model forecasts are different from the recession model. The peak-trough models estimate the probability of the S&P 500 being between the peak and trough associated with an NBER recession. The S&P 500 typically peaks before recessions begin and bottoms out before recessions end. As a result, it is far more difficult for the peak-trough model to fit this data and the model forecasts have larger errors than the recession model.
The Trader Edge aggregate peak-trough model equals the weighted-average of nine different models: the probit and logit models based on the diffusion index, the probit and logit models based on the recession slack index, and five neural network models.
The aggregate peak-trough model estimates from 1/1/2006 to 1/01/2017 are depicted in Figure 5 below, which uses the same format as Figure 4, except that the shaded regions represent the periods between the peaks and troughs associated with NBER recessions.
The aggregate peak-trough model probability estimate for 1/01/2017 was 2.7%, which was down slightly from the revised value of 3.5% at the end of November 2016.
Figure 5: Aggregate Peak-Trough Model 01-01-2017
Conclusion
January and February 2016 marked a potential tipping point in U.S. recession risk, but that risk declined significantly in March and April. Recession risk fluctuated in subsequent months, but continued to decline. The recent decrease in recession risk is supported by both market and non-market variables. The median recession slack index has now increased significantly, confirming the improvement in the diffusion index.
The use of several market-based indicators makes the Trader Edge recession model more responsive than many other models. Relative to traditional economic variables, market-based data have important advantages: they are highly predictive, they are never restated, and there is no lag in receiving the data. The market-based variables improved in March and April, reversed direction briefly, but are again trending higher.
However, reduced recession risk does not eliminate downside risk in the equity markets. The U.S. equity market remains significantly overvalued (highest price-to-sales ratio ever). In addition, S&P earnings have declined by roughly 20% since 2015. Over the same period, the price of the S&P 500 index increased by over 10%. This divergence expanded P/E ratios to historically overvalued levels. While we may be poised for a period of earnings growth, earnings would have to increase by almost 30% (at current price levels) to return to the overvalued P/E levels of 2015.
Mark Hulbert's recent article, "The biggest threat to your money now? Ignoring the scent of a bear market," provides further insight into the relative value of the U.S. equity market. According to Hulbert's research, the current stock market is more overvalued that it was at 80-95% of the last century's bull-market peaks - according to six different valuation measures. For those betting on a Trump policy windfall, Hulbert makes a critical point:
In other words, even if the corporate tax rate were reduced to 15% and corporate earnings were to increase by $12.84 per share, the market would still be overvalued. This rosy picture also assumes that Trump's protectionist trade policies caused no adverse earnings effects. Even in this ideal scenario, the resulting S&P earnings would still be well below the 2015 earnings with much higher prices - not a recipe for low-risk incremental returns.
Unlike human prognosticators, the Trader Edge recession model is completely objective and has no ego. It is not burdened by the emotional need to defend past erroneous forecasts and will always consistently apply the insights gained from new data.
Brian Johnson
Copyright 2017 Trading Insights, LLC. All rights reserved.
Print and Kindle Versions of Brian Johnson's New In-Depth (100+ page) Options Article are Now Available on Amazon.
Option Income Strategy Trade Filters: An In-Depth Article Demonstrating the Use of Trade Filters to Enhance Returns and Reduce Risk
Print and Kindle Versions of Brian Johnson's 2nd Book are Available on Amazon (75% 5-Star Reviews)
Exploiting Earnings Volatility: An Innovative New Approach to Evaluating, Optimizing, and Trading Option Strategies to Profit from Earnings Announcements.
Print and Kindle Versions of Brian Johnson's 1st Book are Available on Amazon (79% 5-Star Reviews)
Option Strategy Risk / Return Ratios: A Revolutionary New Approach to Optimizing, Adjusting, and Trading Any Option Income Strategy
About Brian Johnson
I have been an investment professional for over 30 years. I worked as a fixed income portfolio manager, personally managing over $13 billion in assets for institutional clients. I was also the President of a financial consulting and software development firm, developing artificial intelligence based forecasting and risk management systems for institutional investment managers. I am now a full-time proprietary trader in options, futures, stocks, and ETFs using both algorithmic and discretionary trading strategies. In addition to my professional investment experience, I designed and taught courses in financial derivatives for both MBA and undergraduate business programs on a part-time basis for a number of years. I have also written four books on options and derivative strategies.